In our rural communities, math isn’t just in a textbook; it’s on the side of every tractor, it’s in the dimensions of the fairgrounds, and it’s in the literal soil of the Salinas Valley.
This week, King City is buzzing. It’s Salinas Valley Fair week, and for our community, that’s not just an event; it’s a whole vibe. Between the FFA projects, 4-H exhibits, the animals, school projects, and local farmers showing their best, the town completely revolves around those 31 acres on Division Street.
When we use local data, we aren’t just teaching math; we’re validating the expertise our students and their families bring to the classroom every single day. We make it relevant, tangible, and relatable.
The “Acreage & Arena” Rep
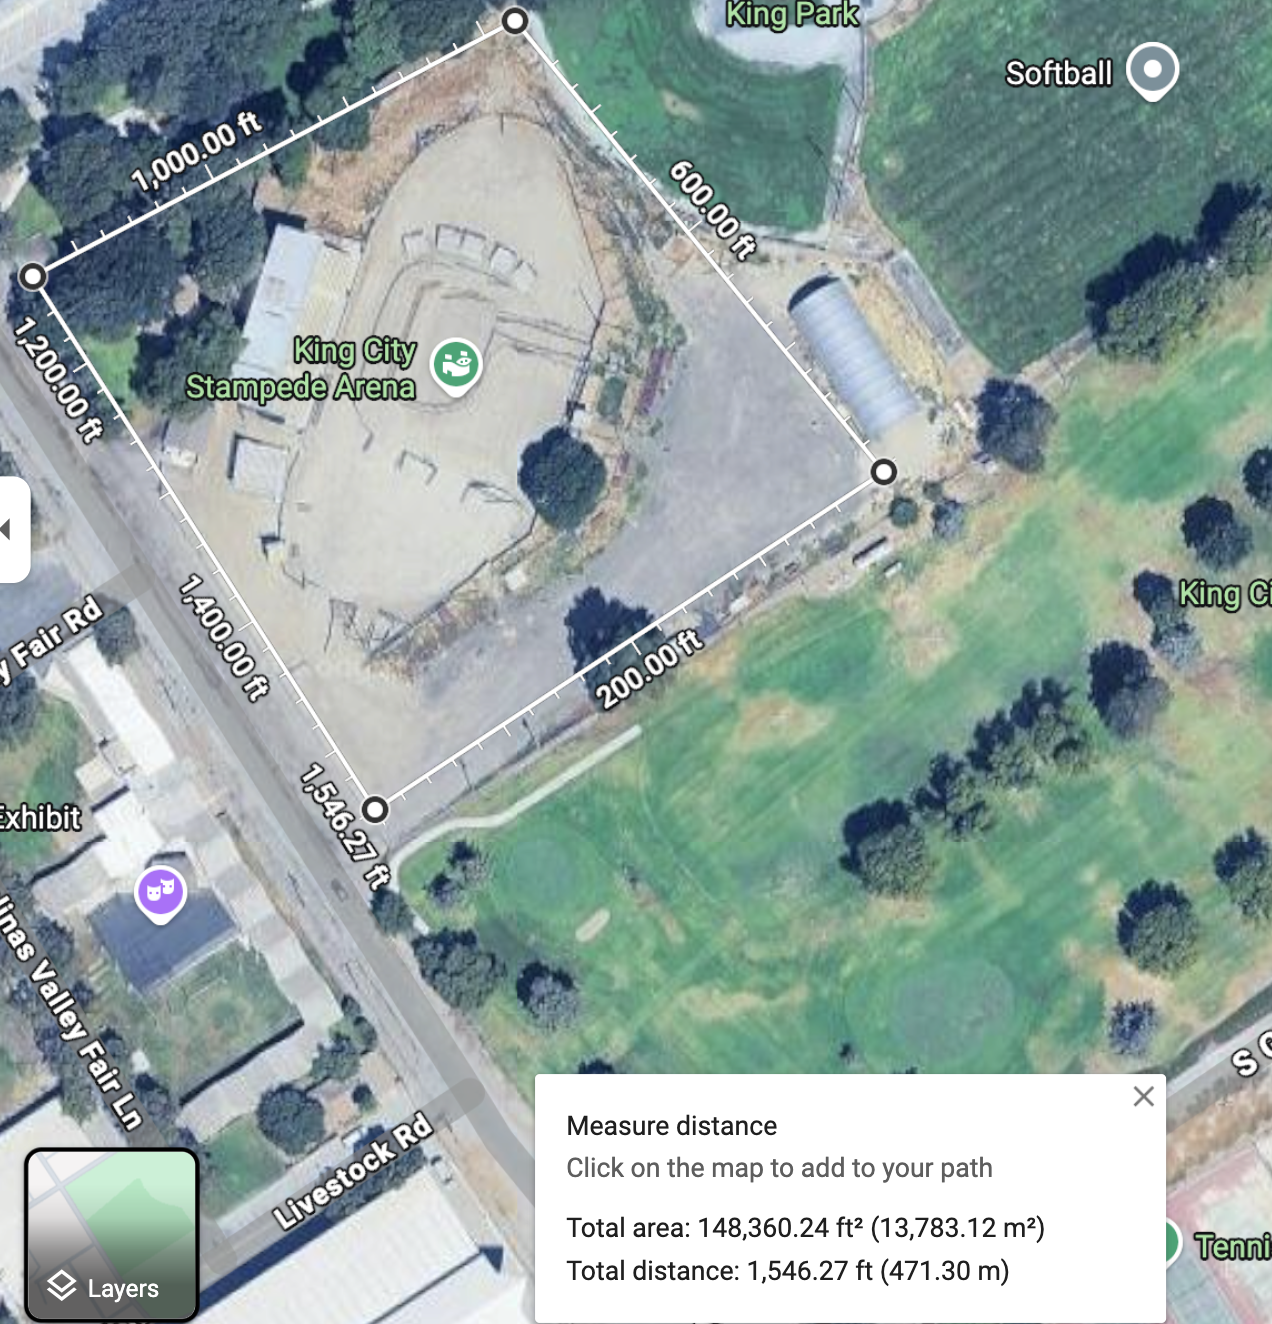
Geometry and measurement feel different when you’re talking about the Stampede Arena.
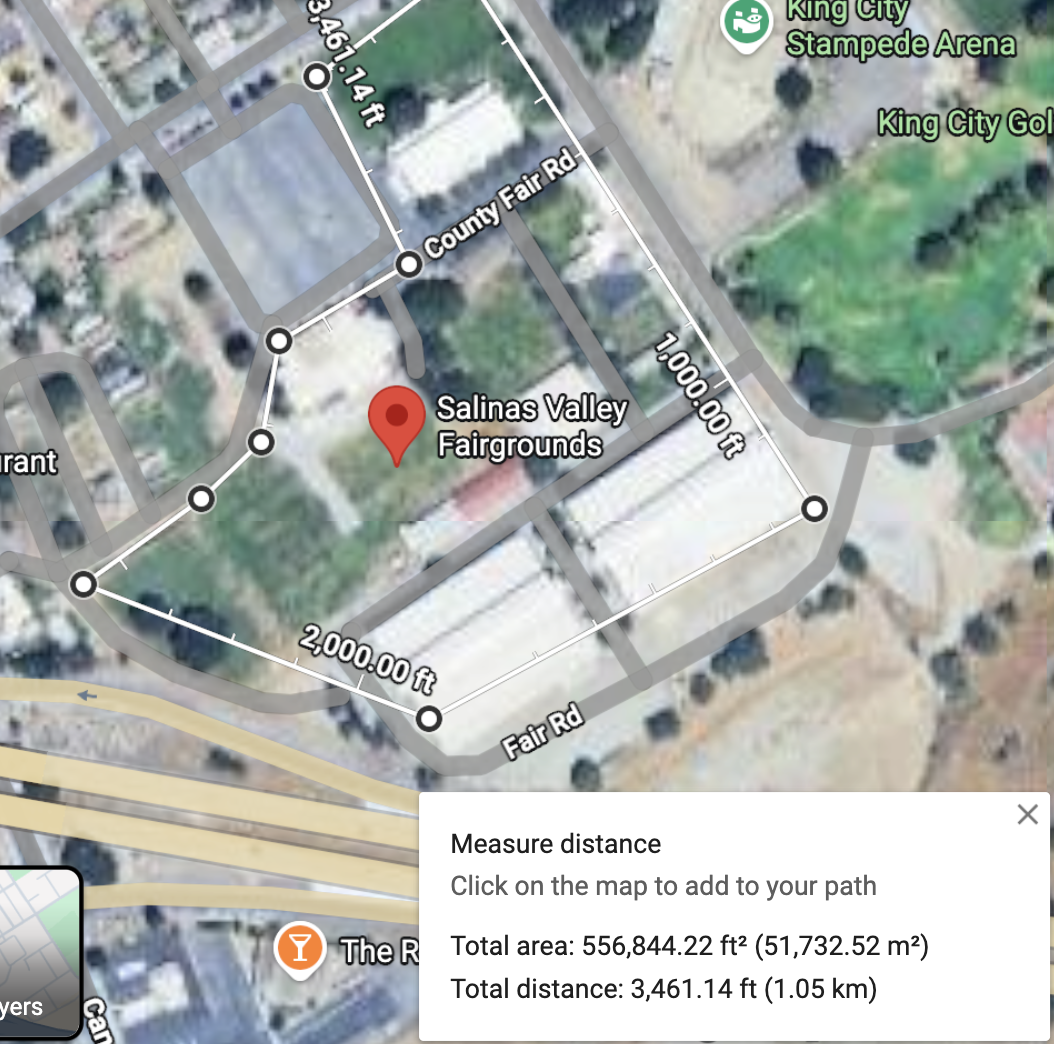
- The Data: The Salinas Valley Fairgrounds spans 31.4 acres. The Stampede Arena is exactly 180ft x 300ft (54,000 sq. ft.).
- The Rep: Instead of finding the area of a generic rectangle, have students use the Stampede Arena dimensions. How many “arenas” fit into the 31.4 total acres?
The “Mustang Stadium” Comparison
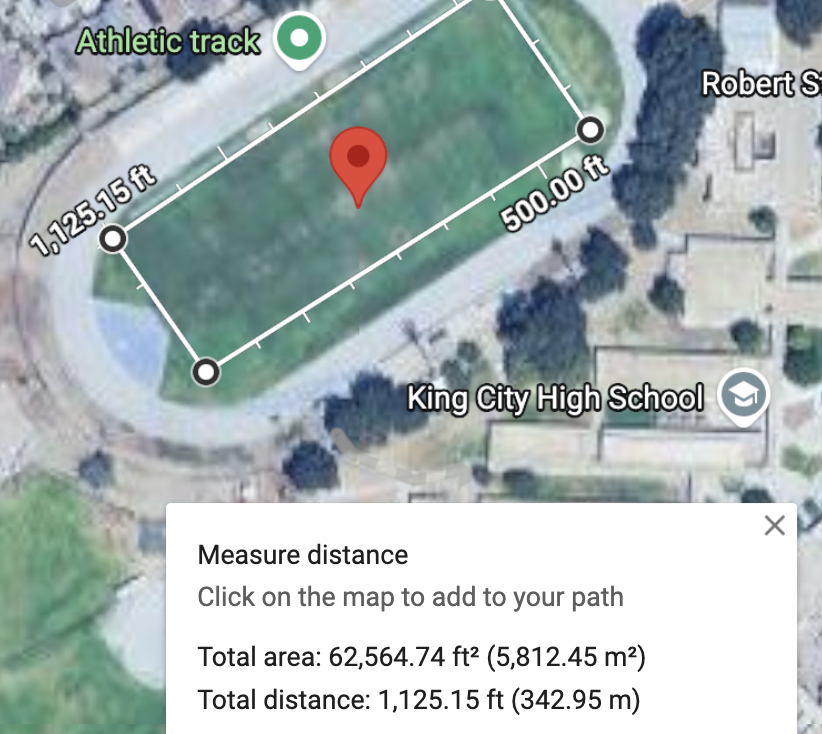
To help students visualize magnitude, use a landmark they know well: War Memorial Stadium at King City High. * The Comparison: A football field is roughly 1.3 acres.
- The Challenge: If our high school stadium is 1.3 acres, and the Fairgrounds is 31 acres, how many Mustang Stadiums could we fit inside the Fairgrounds? (Spoiler: It’s about 24!)
The “Salinas Valley Reach” (Fractions & Percentages)
We live in the “Salad Bowl of the World,” and the percentages are staggering. It’s also Steinbeck Country, so ELA EduProtocols fit well in our area.
- The Data: The Salinas Valley grows 92% of the nation’s broccoli and 76% of its head lettuce.
- The Rep: Use these high-leverage percentages in a fraction or decimal MathRep. This transforms a standard problem into a point of community pride.
Step-by-Step: How to Create a “Homegrown” Map Rep
Creating a MathRep that is relevant to your community is easy. You just need Google Maps and a curiosity about your community.
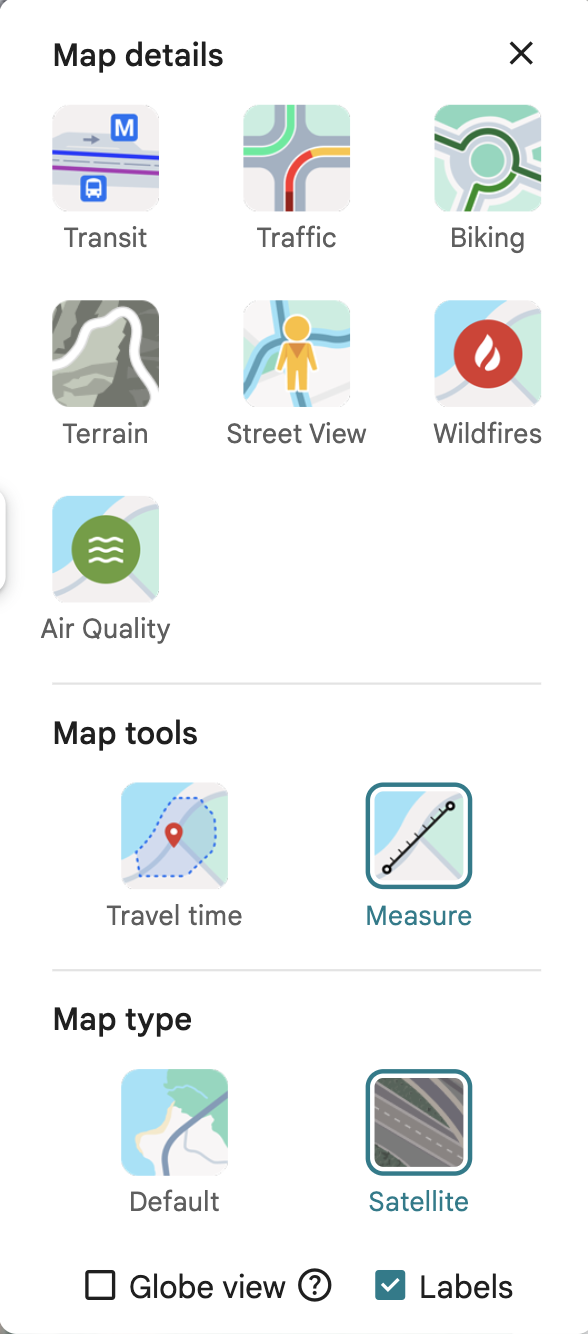
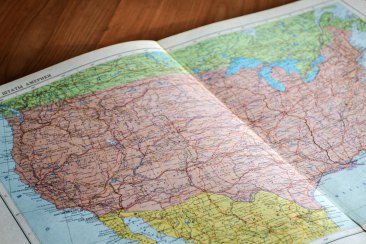
- Find Your Landmark: Open Google Maps in Satellite View and find a spot your students know (like the Fairgrounds or the High School).
- Use the “Measure Distance” Tool: Right-click on one corner of the property. Select “Measure distance.” Click the other corners to close the shape.
- Bridge to the MathRep: Use the Total Area and Perimeter Google provides to fill in your MathRep frames.
The “Community Data Walk”
As we walk the fairgrounds this week, we’ll look at the exhibits through a mathematical lens. Every 4-H weight chart, every FFA livestock pen dimension, and every ag display is a MathRep waiting to happen.
By using the Fair as our “anchor,” we eliminate the “When will I ever use this?” question. The answer is: You’re using it right now, right here in King City. What will be your anchor?
 Not so long ago, I wrote about a


 That’s it. Now take that URL and use a URL shortener like


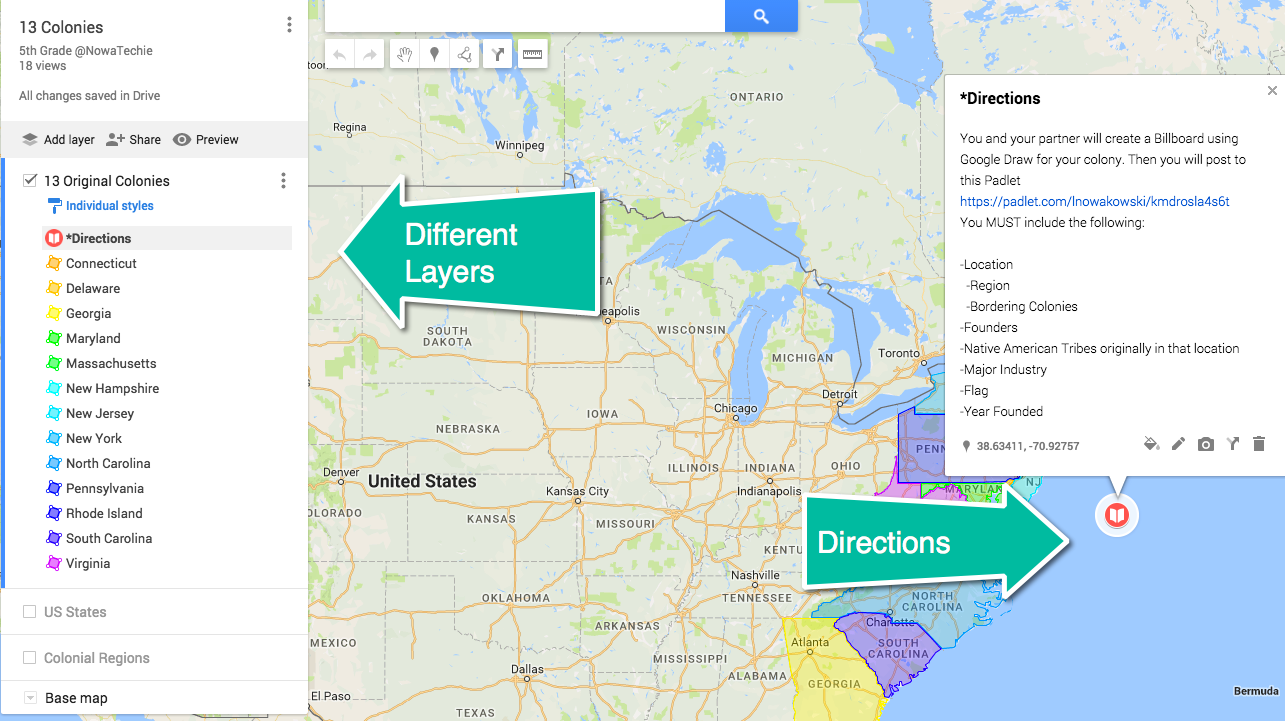
 Before we get to HOW to change the view, set the view to how you would like it to look when the Map is first loaded. Once the desired view is on the screen, click on the 3 dots to the right of the Map Title (#rOxnard1 in this case), a pop out window will then appear with options. One of them is to set the default view.
 Simply select ‘Set default view’ and you’re done! Now everytime this map is opened, it will look like this:
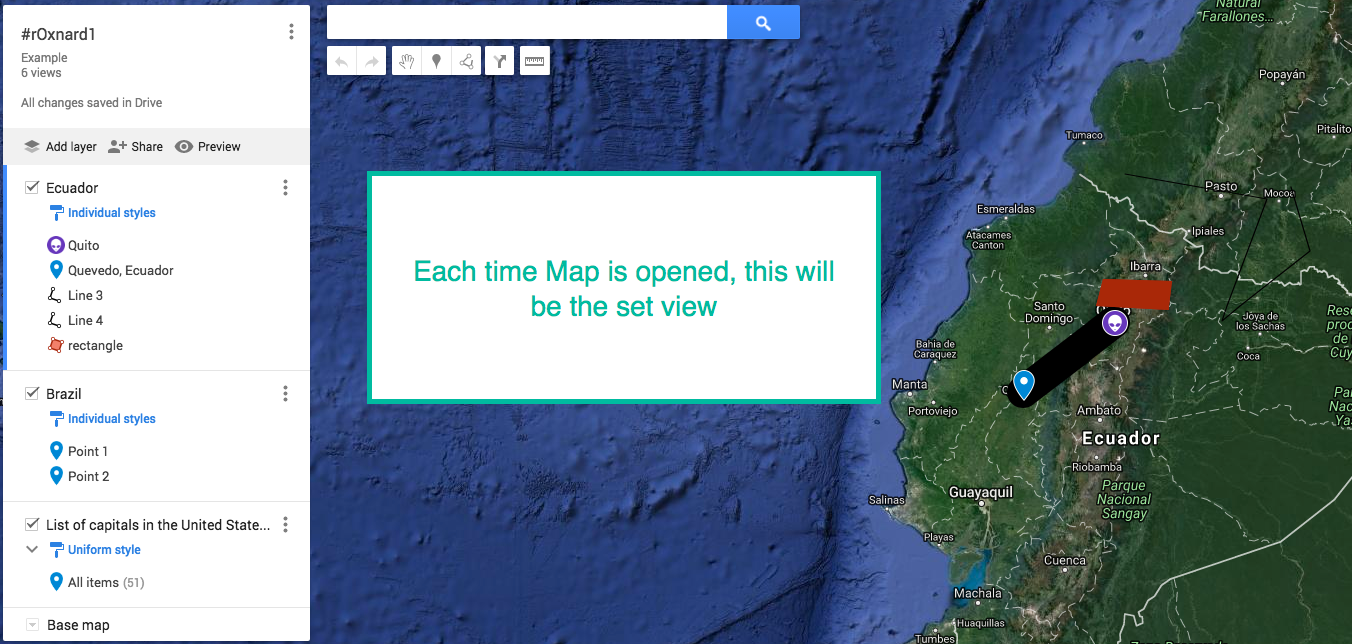
 Google My Maps is found in your
  Last week I had the privilege of being a part of the #cuerockstar #rOxnard faculty. And what an amazing group they were! As tradition, we all had one minute to ‘sing for our supper’ also known as ‘Shred Session’. Yeah, that one-minute time limit? It meant nothing to me! In true RockStar fashion, I went a tad over. In all fairness, Mike Vollmert warned me that my time would soon be up. My response? “I don’t care,” and kept going. That was the first time I ever did that.
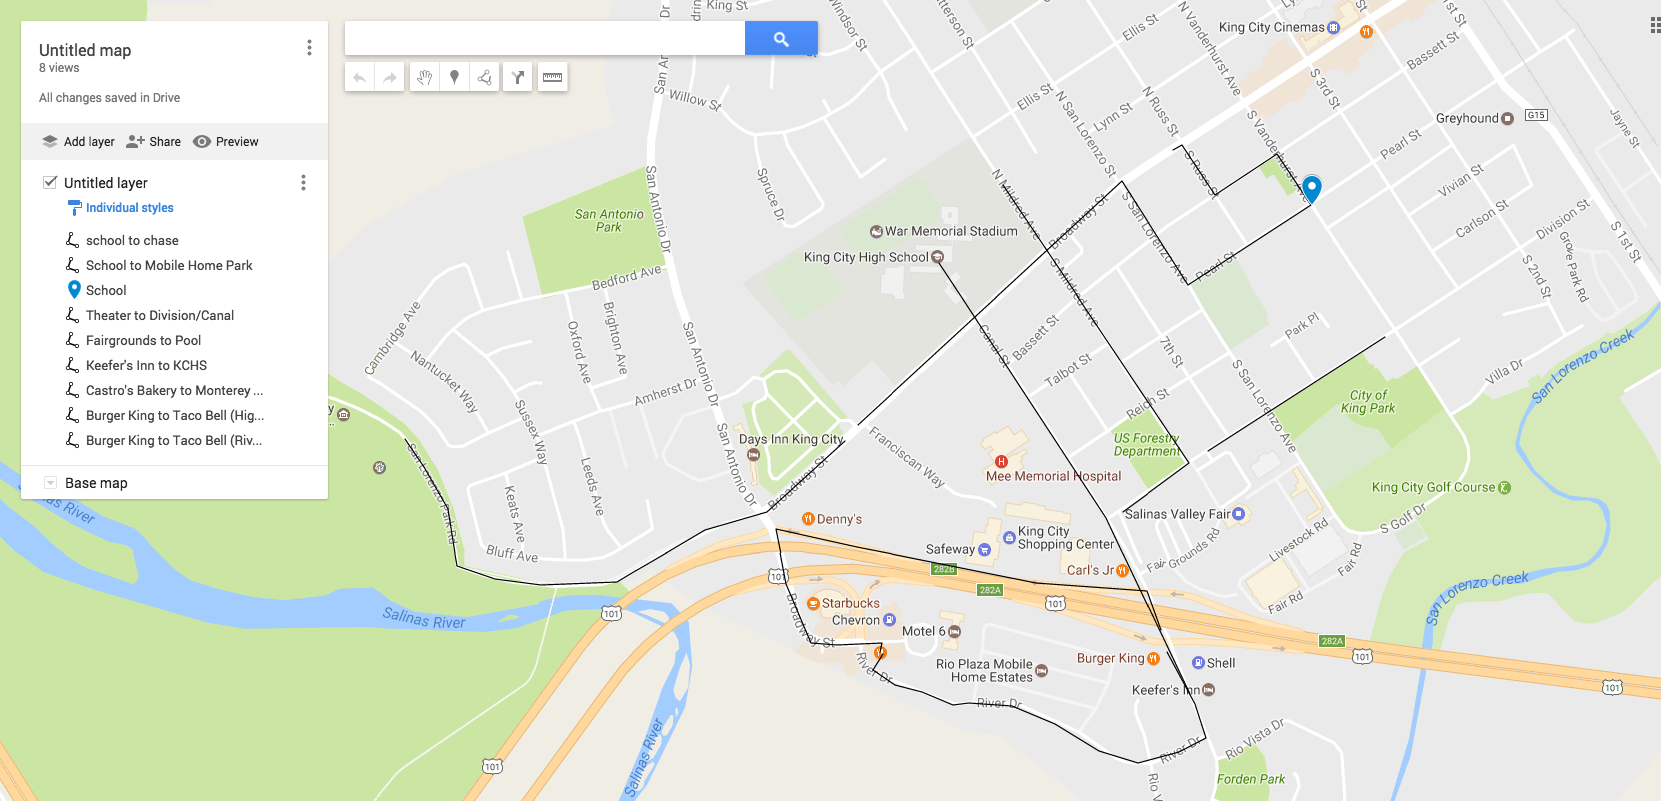 I created this map of our town and included lines (using the