2 Truths/1 Lie: Other Grades

map.jpg
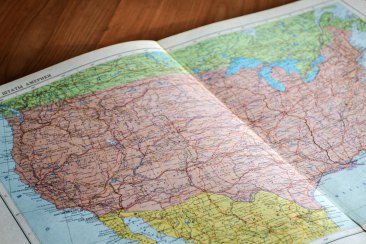
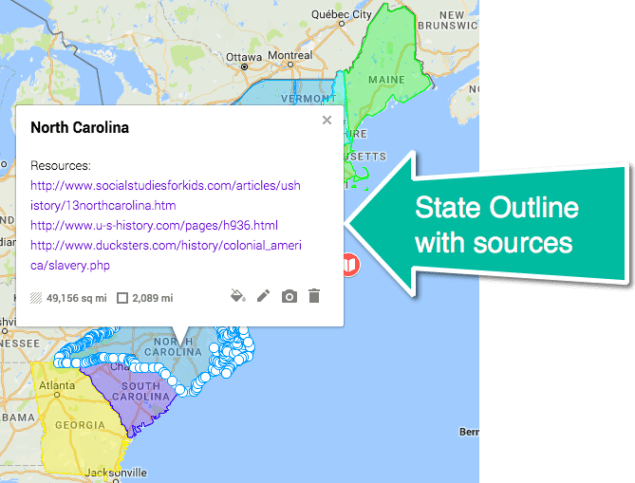
Not so long ago, I wrote about a year-long project (2 Truths & a Lie) that I will be collaborating on with a teacher from Texas. In short, we are working with States as it is a 5th-grade standard. Students will be researching and recording information on a shared Google My Map.

This got me thinking. First of all, anyone who knows me knows that I LOVE using Google My Maps in the classroom. This lesson design can be used with other grades and topics.

matthew-mazzei-104220.jpg

I believe that 2nd-grade studies habitats. Why not draw a polygon around the regions students will be studying and have them create their own 2 truths and a lie on a shared map? Or in 4th-grade for the California Missions, using the draw line tool, draw the Mission Trail and have them create place markers with the information for each Mission. Again, using the draw a line tool, older students can draw the route of armies for the Battles of Lexington and Concord. Or routes and pin markers can be placed on maps to show battles during the Civil War. A class that studies ecology can log information on a map. In ELA, while reading a story, plot points that correspond with locations and practice comprehension using 2 truths and a lie.

I guess what I’m trying to say is that the possibilities are endless with this lesson design. It makes students dig a bit deeper and think about what they read and think. They have to be ready to analyze the information given in order to find the lie.

So what sort of lessons will you do with your students using 2 Truths and a Lie?

2 Truths & A Lie: State Style

map
Photo by rawpixel.com on Unsplash.com

It’s no secret that I LOVE incorporating Google My Maps whenever and where ever I can in the classroom. So a teacher friend, Jennifer Stimpson (who is an AMAZINGLY inspirational scientist/teacher), thought it would be fun to get our classes to collaborate. She is a teacher in Texas and I teach in California. Our students come from drastically different backgrounds, which makes this project all the more appealing. We are going to play 2 Truths and A Lie: State Style.

In short, although the details have yet to be worked out, we will divide our classes into groups. Each group will be assigned a state in which, using Google My Maps, they will need to research the state and write 2 truths and 1 lie. They must cite their source and they may embed a video. This is phase 1.

Phase 2 will then see the teams working on another state, one the other class has completed, to find the 1 lie. Once the lie is found, it must be corrected and sources must be cited.

Finally, phase 3 the two classes will play either a Kahoot or Quizzizz game together. The idea is that students need to know the information for ALL 50 states, not just the ones they did. So students will have to work together, maybe digital notebooks, to study and learn.

We figured that this was way more fun than filling out a blank map of the U.S. What are your thoughts? How can we make it better? Want to join in on the fun? Here is the link to our document with a few more details.

My Maps: Set Default View

Recently I was leading a session on Google My Maps (#cuerockstar #rOxnard) when a question came up: Can you set the view in My Maps? I said, “No, I don’t think so.” Well, I was WRONG. You can set a default view!

It’s so easy, I can’t believe I never noticed. When you first open My Maps, after placing several pins on it, the view is something like the first image. That is unless you have a select few pins in the same area. It’s a zoomed out view of the earth.

set view 0Before we get to HOW to change the view, set the view to how you would like it to look when the Map is first loaded. Once the desired view is on the screen, click on the 3 dots to the right of the Map Title (#rOxnard1 in this case), a pop out window will then appear with options. One of them is to set the default view.

Set view 1
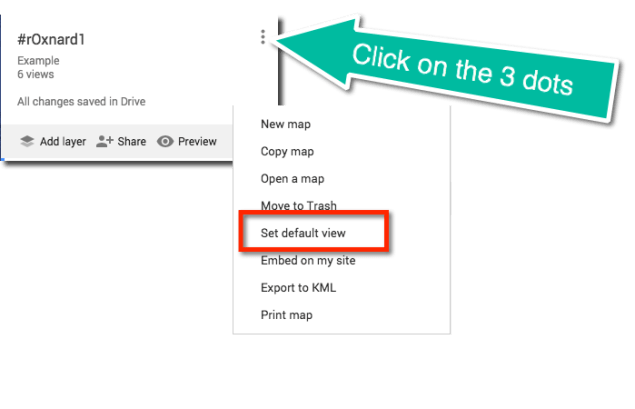
Simply select ‘Set default view’ and you’re done! Now everytime this map is opened, it will look like this: set view 2

My Maps: Underutilized Tool in the Classroom

It’s no secret to anyone that knows me that I LOVE Google My Maps. Yes, there is a difference between Google Maps (the tool that tells you how to get from place to place) and Google My Maps (customizable maps).

Screen Shot 2017-07-20 at 4.34.45 PMGoogle My Maps is found in your Drive. It looks a lot like Google Maps, but as I’ve said, you can customize it. You can put points of interest, photos, directions, lines, shapes, customize the icons, etc. (a list of how to use the tools can be found on my YouTube Playlist).

When people hear about Google Maps (or My Maps), they automatically think it’s solely a geography thing. Teachers are no different. Yes, My Maps lends itself to geography and history quite easily, however, I have used it with Social Studies, ELA, and even Math!

In Social Studies, my students studies Pre-Columbian Peoples. I decided to split them into groups, create a Hyperdoc to find information and then use My Maps to record information. Their final Maps were placed on a Google Site. They created layers, drew shapes, recorded information, inserted pictures and videos, collaborated, learned, and shared.

In Math, students practiced fractions using My Maps. Yes, adding and subtracting fractions with both like and unlike denominators. In Math, there is practice using the measuring tool, comparing distances, it will even tell you perimeter and area of a shape.

In ELA, mimicking Jerome Burg’s Lit Trips, students can retell the story, learn about places, ideas, and the like that appear in the book. Next year, I would like to do this with Bud, Not Buddy, a book I have my 5th-graders read every year.

In another example, I created the HyperMap, same principle as Hyperdocs using My Maps. My students are required to learn about the 13 original colonies. In it, I created layers and gave the directions on the map. The students were then tasked with learning and recording the information (in groups).

If you are a fan of Hyperdocs, then this is a beautiful addition to your lessons. Think about how you can use Google My Maps in your classroom next year. Be sure to share your ideas in here and if you create something fun and exciting, share it on the Hyperdocs website!


#rOxnard Reflection

Screen Shot 2017-07-18 at 1.58.00 PMLast week I had the privilege of being a part of the #cuerockstar #rOxnard faculty. And what an amazing group they were! As tradition, we all had one minute to ‘sing for our supper’ also known as ‘Shred Session’. Yeah, that one-minute time limit? It meant nothing to me! In true RockStar fashion, I went a tad over. In all fairness, Mike Vollmert warned me that my time would soon be up. My response? “I don’t care,” and kept going. That was the first time I ever did that.

Day 1, I shared one of my passions: HyperMaps. Imagine creating a map (using Google My Maps – found in Google Drive) where students learn and the teacher is truly a facilitator. Or having students record their learning on maps. Combine My Maps with photos, websites, documents, etc and the possibilities are endless! I was inspired by the participants. Randi, had the brilliant idea to link a street view image in her map. She teaches her students about pyramids and was setting up a Hypermap that allows her students to experience the sites they learn about. I LOVE sharing the joy that is Hypermaps!

Day 2, for me, was all about green screens and the fun you can have with them! Check out my shred:


IMG_0831

Lots of creating happened! Lots of problem-solving and collaborating. Participants were App Smashing in ways I had never thought of before! I learned so much from everyone this day. Check out this crazy creation by George Carganilla.

If you haven’t been to a CUE RockStar yet, there’s still time!

(Unofficial) #CUE17 Foodie Map

Last week a few thousand educators descended upon Palm Springs for the National CUE Conference. About a week before everyone was set to arrive, Brian Briggs made a comment about getting a crowdsource doc going listing food around the event. So between Brian, Tracy Walker, and myself, we thought it was a GREAT idea. Me, being a My Maps lover, decided to take it to the next level and create a crowdsourced foodie mapScreen Shot 2017-03-22 at 6.49.23 PM

As it had nearly 3,000 views, I’d say it as a hit. And it was something that was needed. When I created it, I pinned 1 restaurant. Looking at how many pins are on it, I’d say the crowdsource part was also a success.

In order to crowdsource it, I had to make sure that it was open for anyone to place a pin. Generally, I wouldn’t open a map up for anyone to place a pin, but this was necessary. And there were no problems. Everyone was respectful. There was even an early morning hike one day! I would have never known about that had it not been placed on the map. I will definitely try to do this again. I love it when things like this are embraced by the masses. What a great resource. Thanks Brian and Tracy for the idea.

Google My Maps: 13 Colonies

Social Studies is a natural place for My Maps to appear. This year I created a HyperMap. This is based on the HyperDoc method. The students are given a map with information they are to know. This information will also be used to create a final product. Sometimes I have them creating a video on Animoto, other times it might be flyers/pamphlets, or some other creative way the students show what they’ve learned.

For the 13 colonies, I created a HyperMap with a few different layers: 13 Colonies, Current 50 States, and Colonial Regions. The students were to take notes and create a final product: a ‘billboard’ for their state. You can view their final products here. (NOTE: The billboard idea came from Los Virgenes School District via a teacher Nancy Minicozzi@coffeenancy – works with).

13-colonies-113-colonies-2

I did NOT create all the outlines. A Google Mapper created a site with some great resources. I downloaded the KML File and then uploaded it to my map (see video).

Using My Maps in this way allowed my students to become more familiar with the territory and they had ownership over their learning. I’m clearly a fan of HyperMaps!

Google My Maps in Math

When one thinks of incorporating Google Maps into their curriculum, the first thought is Social Studies. While that’s quite natural, I have incorporated Maps into most subjects. My latest brainstorm came when I was teaching adding and subtracting fractions. Yup, you read that right, I have students adding and subtracting fractions using Google Maps.

One simple option is to plot a point and place a real-world problem in the description box. Good start, but what if the students used distances to find the sum or difference?

Routes I created this map of our town and included lines (using the draw line tool) to various locations in our town. This is where it got #eduawesome! The distance (which is displayed once the line is chosen) is shown in decimals! This means they have to convert the decimal to a fraction or mixed number, find the common denominator, and THEN add or subtract! And just to make life a bit more fun, I wasn’t too precise on all my lines. This means they also had to ROUND to the nearest hundredth and in some cases simplify!

For example:

Find the difference between Route A and Route B.
Route A – From school to a local Mobile Home Park (0.753 mi)
Route B – Keefer’s Inn to the high school (0.599 mi)

In this case, Route A was rounded to the nearest hundredth (0.75) while Route B was rounded to the nearest tenth (0.6). Then students had to convert this to a fraction and simplify. Route A = 75/100 = 3/4. Route B = 6/10 = 3/5.

Finally, the students were tasked with finding the difference. There were a lot of steps in there, but it was so much more fun than writing out and solving problems in the workbook. This was more in depth than any workbook I’ve seen, more fun, easy to create, and used a variety of acquired skills. I will be doing more things like this in the future.

Google Maps in Class: State Reports

A few years ago I was looking for something new to do with state reports so I had students do them using Google Maps. Part of my desire to do something different came from frustration. I had been doing state reports near the end of the year. And that means NO ONE really wants to do them and I don’t want to read them – for the sheer fact that the quality isn’t there (end of the year, in 5th grade, last grade in our elementary school…see my point).

screen-shot-2017-02-05-at-1-38-06-pmHowever, when I changed the format to maps, the engagement and quality significantly improved. Students entered in the morning ASKING to do the ‘reports’. In the end, it was much more enjoyable for everyone! They still had to do the research and write a quality report.

State Report on Maps Directions.

Here’s a student example:

screen-shot-2017-02-05-at-1-39-54-pm

NOTE: While ‘Sate Reports’ are a tradition in 5th grade, it is not actually a standard. The standard, in California, states:

5.9 Students know the location of the current 50 states and the names of their capitals

This standard can be met by participating in Mystery Skypes/Hangouts and various other engaging activities. Just because we’ve always done something doesn’t mean we have to continue doing it.

Google My Maps Part 11: KML/KMZ Files

Recently I was doing a project and wanted the 13 original colonies map, but didn’t want to outline each state. Instead, I downloaded the .KMZ file of all 50 states (Map found here) and deleted all but the original 13. I had to do some modifications, but that was so much easier than recreating it all from scratch. And it was so easy to export the file then import it into my map.