As a Tech TOSA, I often surprise people when I come into a class where no technology is needed. We have been conditioned to think that being “Tech-Forward” means more screens and more apps, but I’ve found that true technology integration is actually about the “Edit.” It’s about having the courage to ask why we are using a tool and if it actually levels up the assignment.
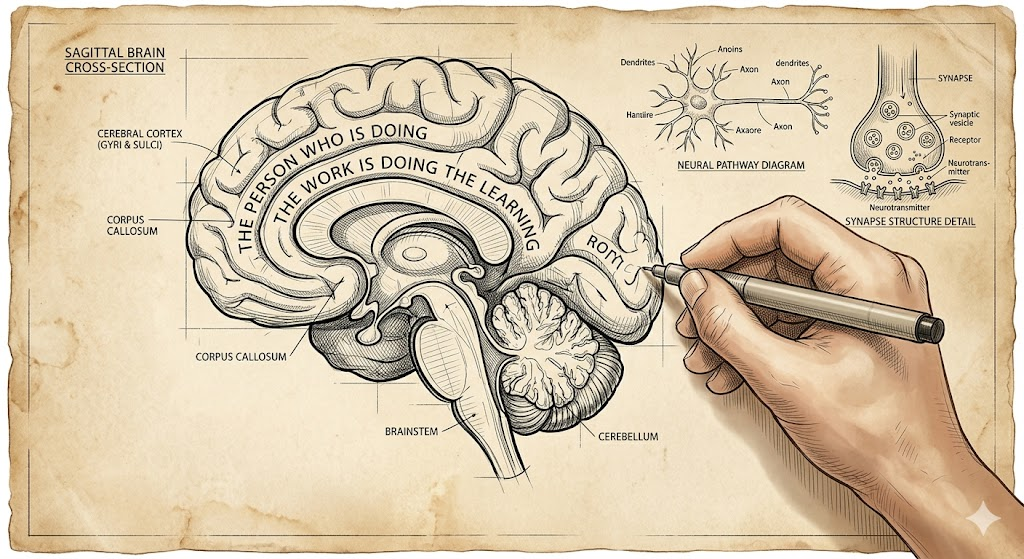
I’ve always lived by one rule in my classroom: “The person who is doing the work is doing the learning”. If the technology is doing the heavy lifting, the student is just a passenger.
The Power of the “Closed Lid”
The “Edit” starts with the foundation of the Closed Lid. In many classrooms, an “open lid” can create a “stimulation tax” that pulls focus away from Priority Standards and learning. I tell teachers that the most powerful thing they can do is give their students permission to unplug so they can focus on the raw logic of the lesson.
For those who are tech-nervous, stopping at paper and pencil is a perfectly valid pedagogical choice. However, for those looking to “lighten the load,” we can build a bridge to a tool like Snorkl.
The Powerful Team:
- Phase 1: Students do the messy, non-linear work on paper—doodles and all!.
- Phase 2: They take a quick photo of that work and upload it to Snorkl.
- The Payoff: The teacher gets immediate feedback and a clear window into class-wide progress without having to collect a stack of 30 physical papers.
Editing the Distractions: The 3-Font Rule
Once the thinking has been captured on paper, moving to the screen brings a new set of challenges. I can’t tell you how many times I’ve watched students waste fifteen minutes finding a font, and sometimes color, instead of developing an idea.
This is why I advocate for the 3-Font Rule:
- The Constraint: Students choose from only three fonts and one size (12pt). Think boring. There is a time and place for the ‘fun’ fonts.
- The Logic: This isn’t about being restrictive; it’s about protecting “think-time”. When we “edit” the infinite choices of the digital world, we remove the barrier to the standard, allowing the student to focus on the content.
The “Individualized Edit” and Equity
The “Edit” mentality isn’t one-size-fits-all. We have to remember that for some students, the technology is the bridge that allows them to do the work.
- The Equalizer: For a student with an IEP, dictating notes into a computer can be the tool that enables them to synthesize information.
- The Success Story: I once had a student who wasn’t a strong reader. While the rest of the class read, he watched videos and took notes by hand. Because he had the right “Edit” for his needs, he was successful.
The Neuroscience “Why”
Why does the “Edit” back to paper work so well? Recent science shows that handwriting is actually a “high-performance” activity for the brain. A 2025 study published in the journal Life revealed that handwriting engages significantly wider neural networks than typing.
Final Thought
The “Edit” mentality isn’t about being anti-tech; it’s about being pro-brain. We use technology when it enhances the lesson, but we have the courage to close the lid when the technology becomes a distraction. By editing out the noise, we ensure that the students remain the ones doing the thinking.
Because at the end of the day, if they aren’t doing the work, they aren’t doing the learning.
 Not so long ago, I wrote about a
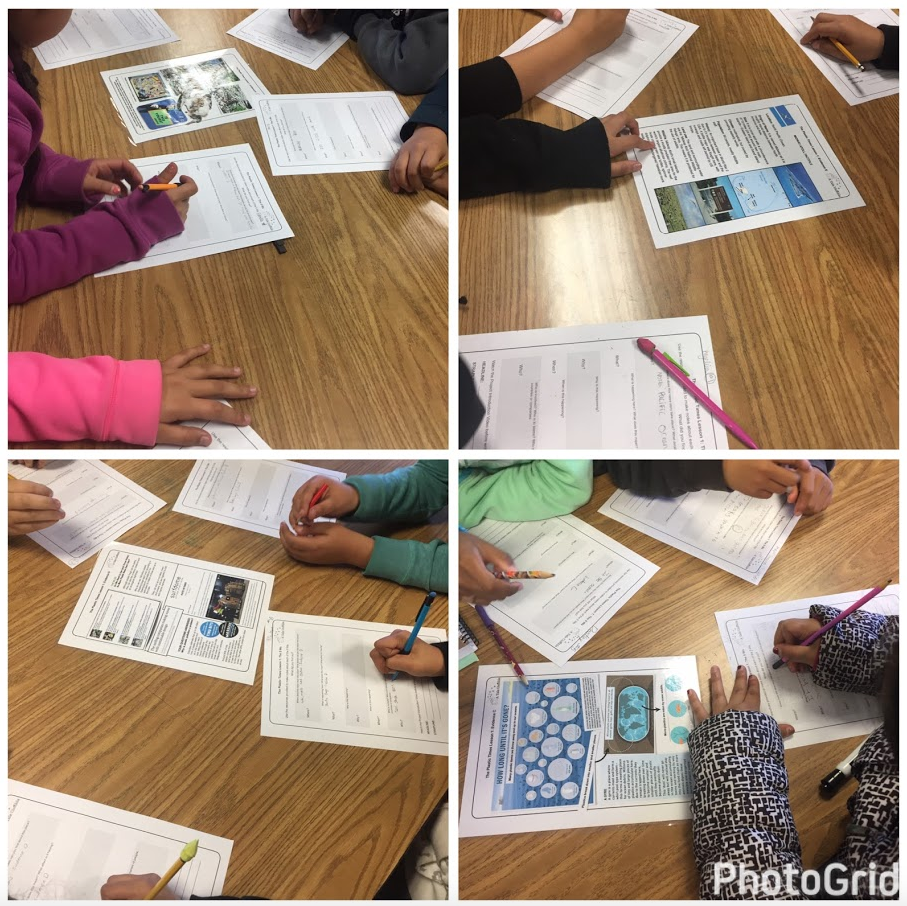 Friday we started our new path. The first lesson has students reviewing five different pieces of ‘Evidence’ (all factual) and taking notes. They are investigative reporters learning about the impact of plastic on our environment, animals, and us. Then, they are to form an action plan. When each group received their ‘Evidence’ I don’t think they thought I would stick to the 4-minute timer. I printed one copy of each piece of evidence and so they had a certain amount of time to review and take notes before passing it along. After the first round, they got the message. They then watched a 14-minute video produced by CNN to further their knowledge on the subject. Honestly, I have never seen the students so engaged. They really wanted to get all the information provided and answer all the questions on the guiding worksheet. And that was only day 1! I can’t imagine what the rest of the three weeks will bring, but I’m excited to see where this takes us!
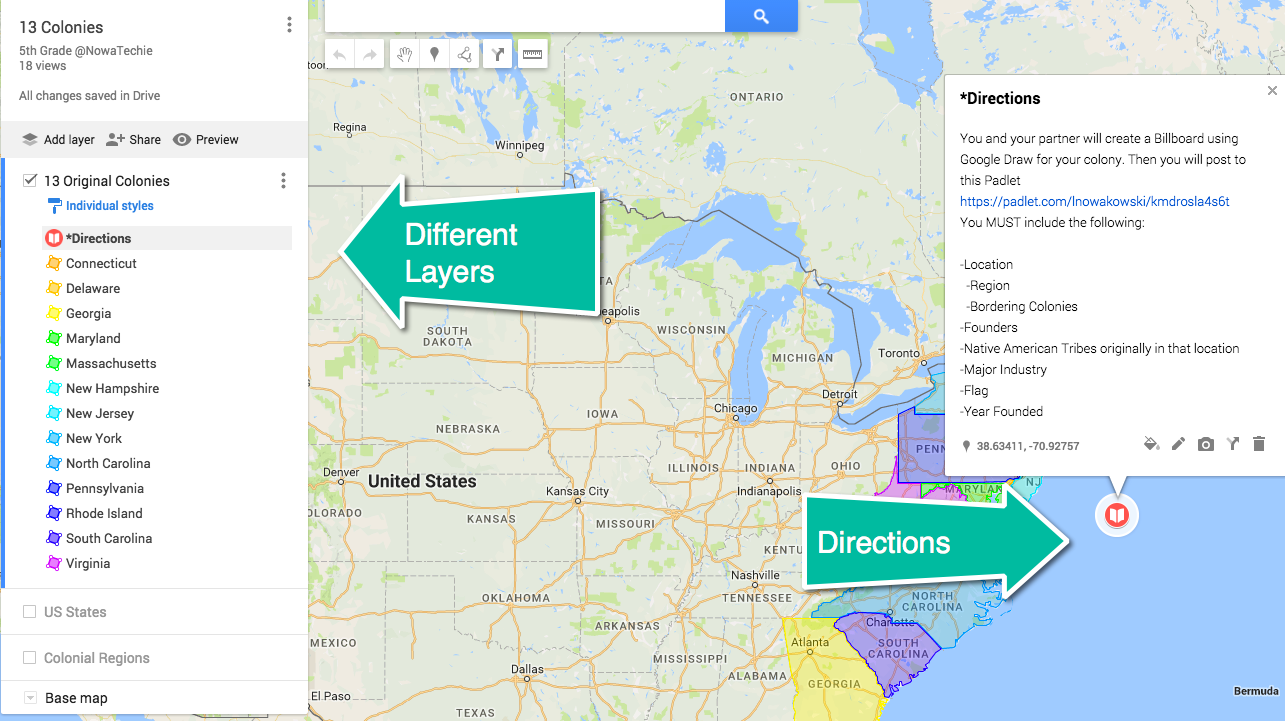
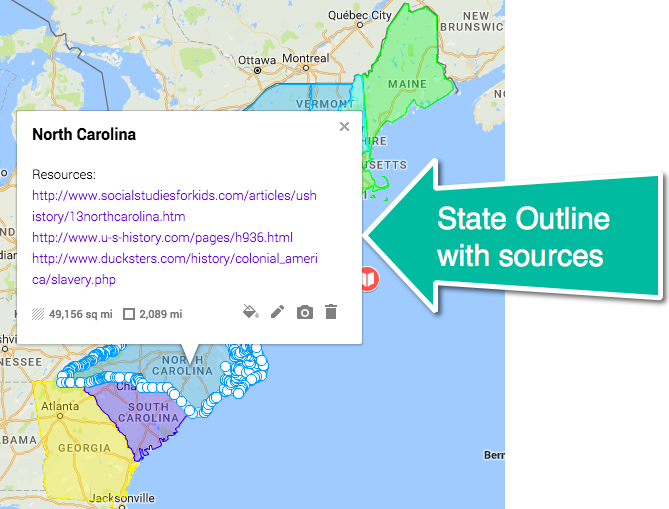
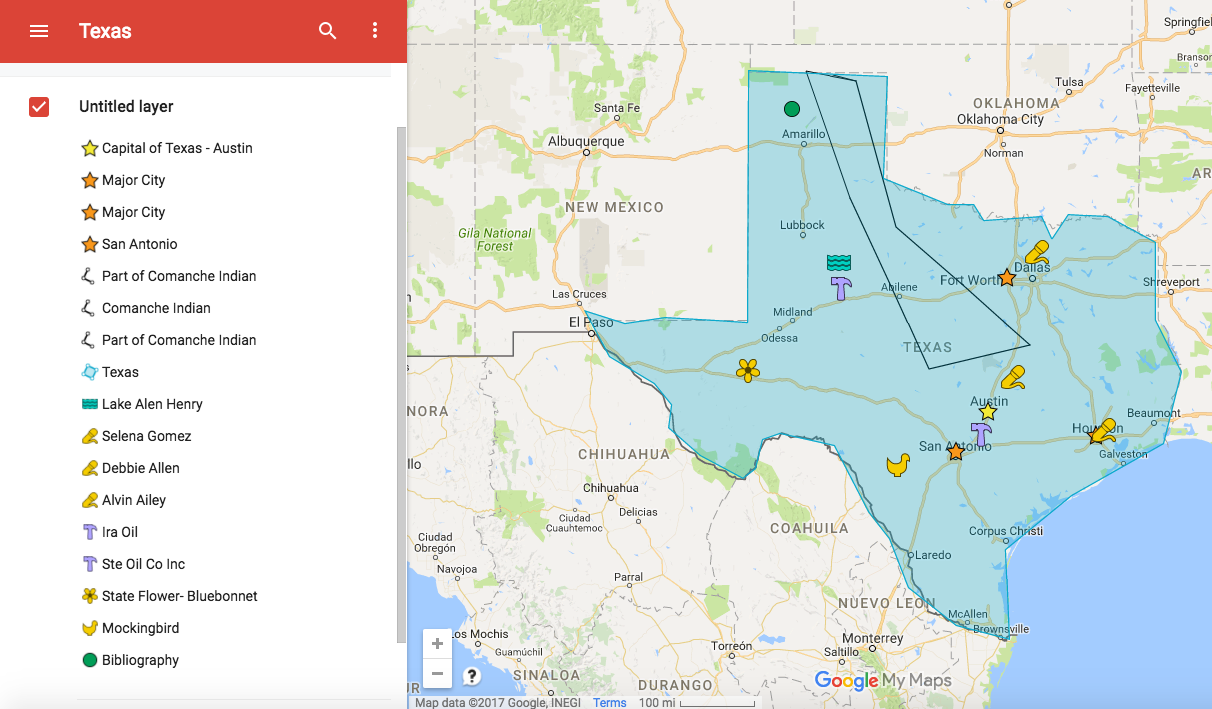
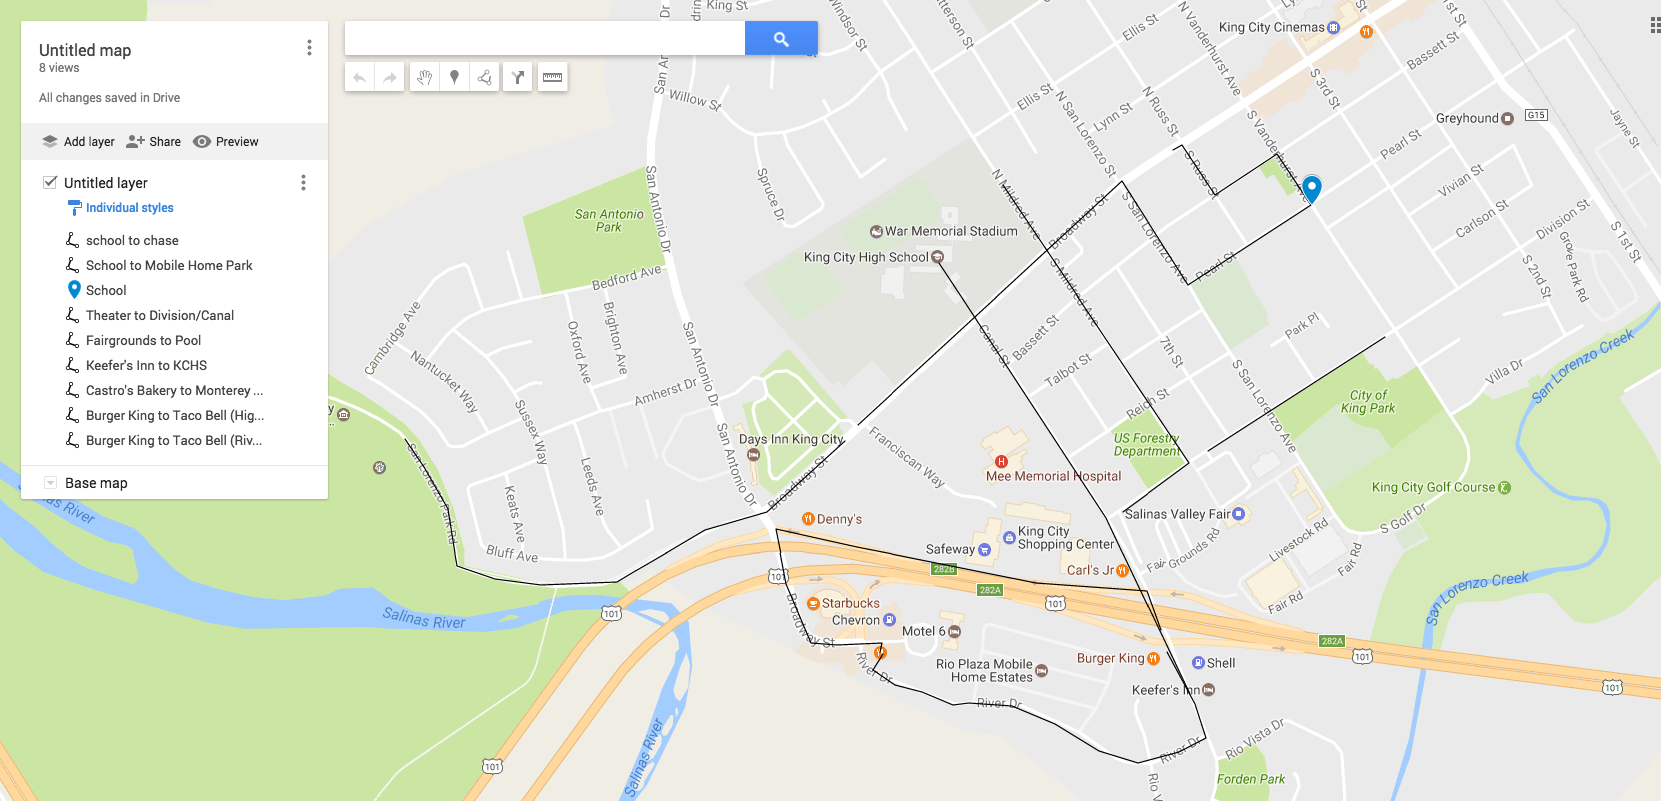 I created this map of our town and included lines (using the
  However, when I changed the format to maps, the engagement and quality significantly improved. Students entered in the morning ASKING to do the ‘reports’. In the end, it was much more enjoyable for everyone! They still had to do the research and write a quality report.