Using Google allows the user to seamlessly integrate items in the Google Suite. Inserting something from your Drive is as easy as a click of the button. Rearranging and adjusting your layout is even easier! The simplicity of the tool is one of the most attractive features.
Author: Admin
New Google Sites Part 2: Header
New Google Sites helps take the guess work out of creating a custom header. There are several options to create just the right header for your site. Google has some preset headers, allows you to search free to use images, and even gives the option to upload your own image. And the process is so easy!
New Google Sites Part 3: Insert
Inserting items on the last version of Google Sites (which I loved) was a bit complicated. However, with the New Google Sites, it’s as easy as 1 or 2 clicks! Check it out:
Place Value Basics & Mult./Div.
Last year, I began using Jon Corippo‘s 8 p*ARTS . I saw great success with the repetition. As a result, I thought I’d like to do something along similar lines with Math. Now, I will admit, what I came up with isn’t nearly as fun. However, the repetition is there. This is for 5th grade and can easily be modified for other grades. Here’s what I came up with.
The plan:
- Today’s Number – Have the student of the day decide on the day’s number anywhere from billion to thousandths place. However, the number must be at least to the tenths place.
- 10 times greater – Take the original number and make it ten times greater.
- 100 times greater – Take the original number and make it one hundred times greater.
- 1,000 times greater – Yup, take the original number and make it one thousand times greater.
- Add 10 times greater and 100 times greater – add the numbers.
- Write a number that is GREATER – Have students change ONLY a digit that is AFTER the decimal.
- 1/10 times less – Take the original number and make it ten times less.
- 1/100 times less – Take the original number and make it one hundred times less.
- Subtract 1/10 and 1/100 – subtract the numbers.
- Write a number that is LESS – Have students change ONLY a digit that is AFTER the decimal.
- Prime factors of the first 2 digits of the whole number – Only take the numbers in the ones and tens place and find the prime factors.
An example is given on the second slide. This should be done daily, with an assessment each week. The first week or two should be done as a group until the class understands what is expected. Once they ‘get the hang of it’ all that is needed is the number and the students can do this independently.
Update: Since the beginning of the year, I have added a new daily practice paper. Now that they can do the Mult/Div paper well, I switch back and forth. I will soon add a fractions practice paper to the mix.
NEW Google Sites Part 1: Getting Started
I was a fan of the old Google Sites, but admittedly it was clunky. Last year when Google announced its launch of the new sites I was stoked! It was the update I had been waiting for for years. The look is sleek and it’s easy to build a beautiful site. Now that it’s out of just the edu market, I’m even more thrilled. This video will kick off my video series on the New Google Sites!
Custom Slides Size
I love slides and the flexibility I have with them. I have been using them more and more, in the classroom, for something other than Presentations. I recently wrote how my students were using them to take collaborative notes. I have also used them as assessments in math and more recently as a version of Hyperdocs. One advantage to using Google Slides is that I have the capability to customize the size of the slide. This means if I want to make it the size of an 8.5 x 11 in paper and print it out, I can. Here’s how:
When open in Slides, go to ‘File’ on the Menu bar and select ‘Page Setup’:

This will open a pop-out window. The default is ‘Widescreen 16:9’. Select the dropdown menu and find ‘Custom’.
This will prompt another window which will ask the size you want. The default is inches but can be changed to centimeters, points, or pixels. Once you have your desired size, select the blue ‘OK’ button. And viola, you will have your custom size. 

Google My Maps: 13 Colonies
Social Studies is a natural place for My Maps to appear. This year I created a HyperMap. This is based on the HyperDoc method. The students are given a map with information they are to know. This information will also be used to create a final product. Sometimes I have them creating a video on Animoto, other times it might be flyers/pamphlets, or some other creative way the students show what they’ve learned.
For the 13 colonies, I created a HyperMap with a few different layers: 13 Colonies, Current 50 States, and Colonial Regions. The students were to take notes and create a final product: a ‘billboard’ for their state. You can view their final products here. (NOTE: The billboard idea came from Los Virgenes School District via a teacher Nancy Minicozzi – @coffeenancy – works with).

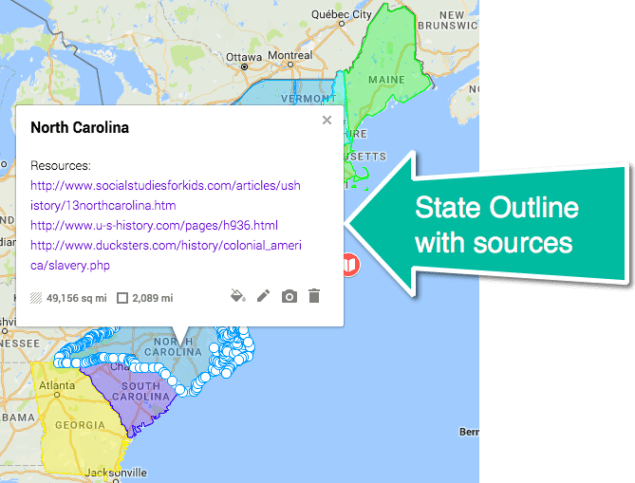
I did NOT create all the outlines. A Google Mapper created a site with some great resources. I downloaded the KML File and then uploaded it to my map (see video).
Using My Maps in this way allowed my students to become more familiar with the territory and they had ownership over their learning. I’m clearly a fan of HyperMaps!
Google My Maps in Math
When one thinks of incorporating Google Maps into their curriculum, the first thought is Social Studies. While that’s quite natural, I have incorporated Maps into most subjects. My latest brainstorm came when I was teaching adding and subtracting fractions. Yup, you read that right, I have students adding and subtracting fractions using Google Maps.
One simple option is to plot a point and place a real-world problem in the description box. Good start, but what if the students used distances to find the sum or difference?
 I created this map of our town and included lines (using the draw line tool) to various locations in our town. This is where it got #eduawesome! The distance (which is displayed once the line is chosen) is shown in decimals! This means they have to convert the decimal to a fraction or mixed number, find the common denominator, and THEN add or subtract! And just to make life a bit more fun, I wasn’t too precise on all my lines. This means they also had to ROUND to the nearest hundredth and in some cases simplify!
For example:
Find the difference between Route A and Route B.
Route A – From school to a local Mobile Home Park (0.753 mi)
Route B – Keefer’s Inn to the high school (0.599 mi)
In this case, Route A was rounded to the nearest hundredth (0.75) while Route B was rounded to the nearest tenth (0.6). Then students had to convert this to a fraction and simplify. Route A = 75/100 = 3/4. Route B = 6/10 = 3/5.
Finally, the students were tasked with finding the difference. There were a lot of steps in there, but it was so much more fun than writing out and solving problems in the workbook. This was more in depth than any workbook I’ve seen, more fun, easy to create, and used a variety of acquired skills. I will be doing more things like this in the future.
Student Ownership
I love this time of year. That time of the year where you’ve hit that ‘sweet spot’ with your class: they know the routines, they can work independently, and they know they have a stake in the success of the class. On Friday, my students wanted to know if we were having a Valentine’s Day party. Personally, I don’t care. I told them that it was up to them. Of course, they decided to go for it.

Then, a group asked if they could decorate the room. Again, I said go for it that it was their thing. This group, made up of both genders, got together during Genius Hour to create decorations for the classroom. They also informed me that they were not done and would continue next Genius Hour. How cool are they?
We also have another issue to decide. We usually have parties near the end of the school day for obvious reasons. However, Valentine’s Day is also First Tee (Golf) day. We go in the afternoon. Our current dilemma is when to have it. On the 14th at lunch? On the 13th? Wait until 17th (Genius Hour)? This was not a popular option. I’m letting them decide. Majority rules.
I just love days like this.
Google Maps in Class: State Reports
A few years ago I was looking for something new to do with state reports so I had students do them using Google Maps. Part of my desire to do something different came from frustration. I had been doing state reports near the end of the year. And that means NO ONE really wants to do them and I don’t want to read them – for the sheer fact that the quality isn’t there (end of the year, in 5th grade, last grade in our elementary school…see my point).
 However, when I changed the format to maps, the engagement and quality significantly improved. Students entered in the morning ASKING to do the ‘reports’. In the end, it was much more enjoyable for everyone! They still had to do the research and write a quality report.
State Report on Maps Directions.
Here’s a student example:

NOTE: While ‘Sate Reports’ are a tradition in 5th grade, it is not actually a standard. The standard, in California, states:
5.9 Students know the location of the current 50 states and the names of their capitals
This standard can be met by participating in Mystery Skypes/Hangouts and various other engaging activities. Just because we’ve always done something doesn’t mean we have to continue doing it.
