This past summer, I’ve been sharing insights about the MathReps collection available in Snorkl. In my recent post, New MathReps Available in Snorkl Library, I provided a quick guide on how to easily navigate the platform to discover your favorite MathReps. Don’t miss the latest video that demonstrates how to seamlessly add these resources to your library and customize them to suit your specific needs.
Math Dash Chats: Boost Classroom Discourse
Earlier this year, a simple idea sparked a solution to a common challenge in many classrooms: how to review math concepts and encourage student conversation when time is short. This led to the creation of Math Dash Chats.
Our district, like many others, was grappling with a noticeable gap in our curriculum—a lack of dedicated time for math discourse. We know that talking about math helps students solidify their understanding, but with so many standards to cover, where do you fit it in? I created Math Dash Chats for 3rd Grade, as an instructional coach who works closely with 3rd-grade teams, it felt like the perfect place to start. Since then, I’ve created sets for grades 2-6 and am excited to expand to grades 7 and 8 soon.
So, what exactly are Math Dash Chats, and how can they help your students? I’m so glad you asked!
What are Math Dash Chats?
Math Dash Chats are 36 prepared slides for your grade level (currently grades 2-6). The activity is designed to be a quick, five-minute daily review that gets students talking.
The slides are divided into six sections, five of which are based on Common Core domains like Geometry and Measurement, and the sixth is a directions section. Problems are hidden behind colorful “doors” [01:05], which you can view beforehand. Then, simply drag the questions over for a fun and engaging reveal.
How Do They Work?
The idea is simple: choose one “door” a day to discuss for about five minutes. This brief, focused discussion ensures a consistent review without taking up valuable class time. The topics covered are not just standard procedures; they encourage students to explore reasoning, number sense, and even domains like geometry or measurement that are often rushed through or left for the end of the year.
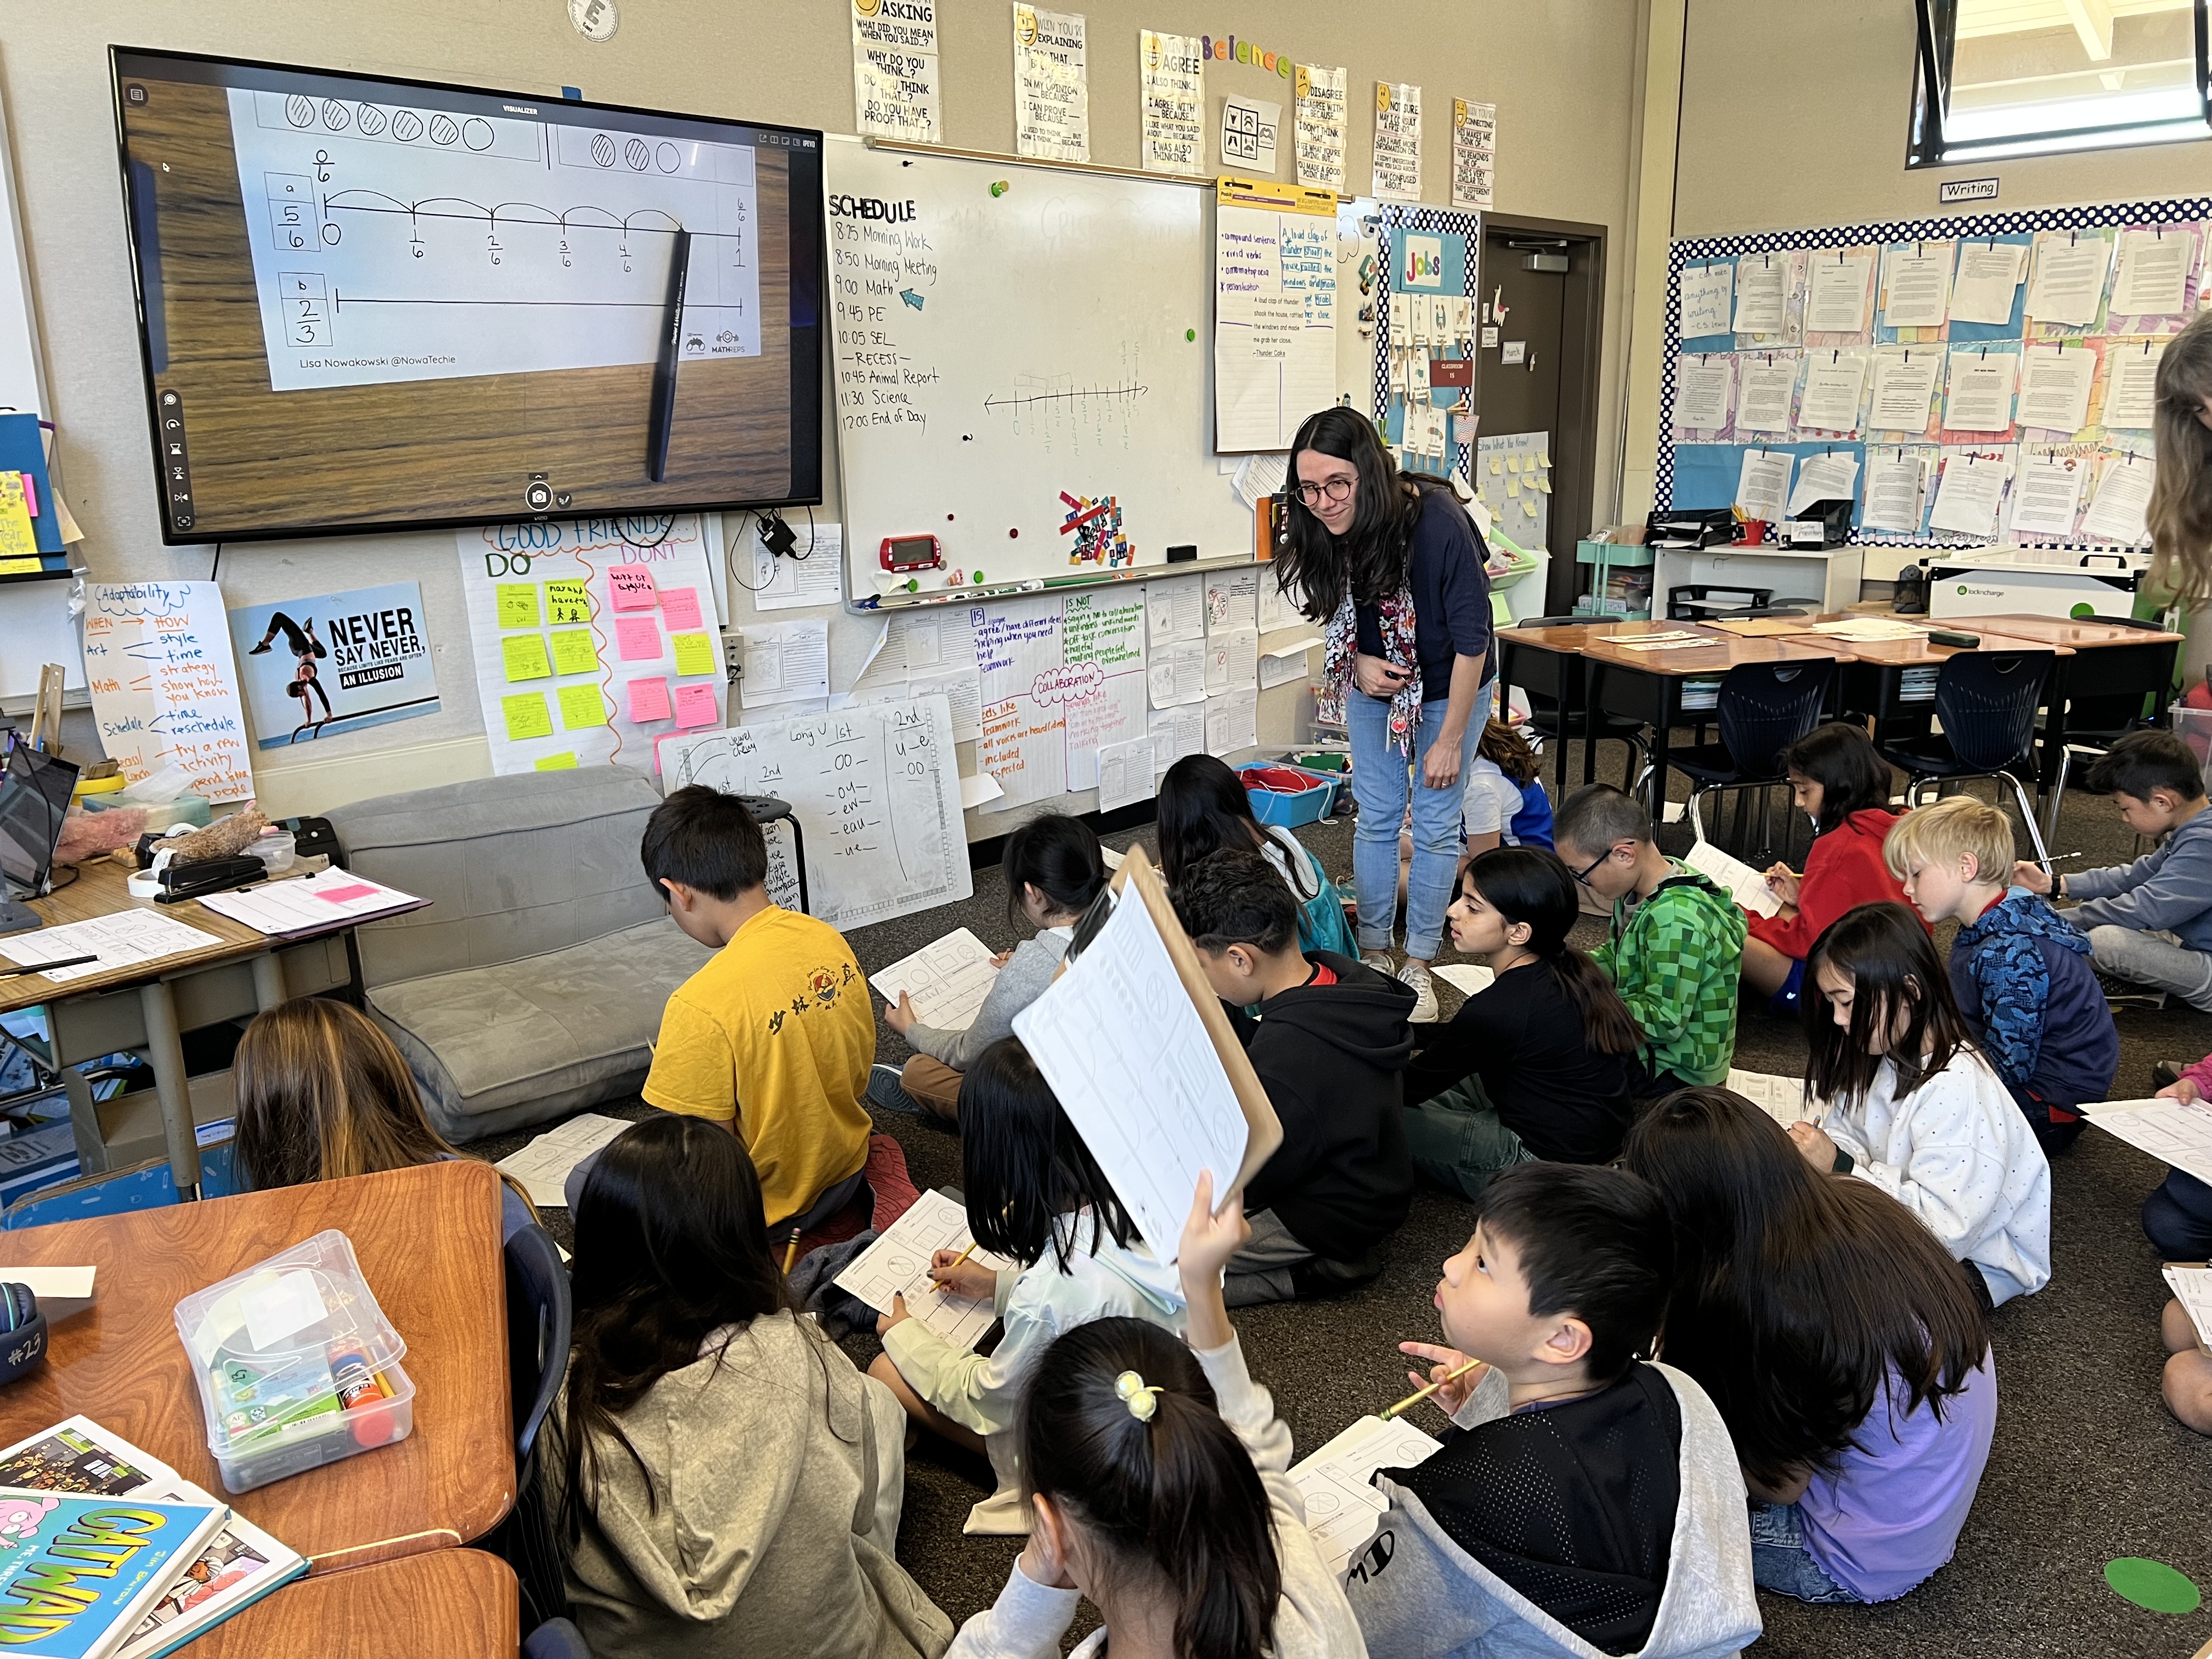
The video provides an example from the “Convince me that” category, where students are asked to prove that “4 tens is the same as 3 tens and 10 ones” [01:53]. This type of question promotes collaboration, and you might find that students want to use personal whiteboards or manipulatives to work through some of the problems together.
The Result
The response from teachers has been overwhelmingly positive. They love the ease of a no-prep, ready-to-go resource that gets students talking about math. Who doesn’t love a well-thought-out, free resource that is proven to work?
If you’re looking for a quick, impactful way to review math concepts and get your students engaged in meaningful math conversations, Math Dash Chats are for you!
Math Dash Chats Folder: Please make a copy of the desired slide deck for yourself by selecting ‘file’ > ‘make a copy’. If you receive a message that says ‘Access Denied’, it may be an issue with your district account. I’ve encountered this recently. If this happens, I suggest trying your personal account and sharing it with your district account. If that doesn’t work, contact me and we can try a few other options.
Public Education: More Than a Viral Post
Lately, it feels like my social media feed has been sprinkled with negative takes on teachers and public education. Over the summer, I noticed an uptick in posts that painted educators in an unflattering light. Some parents shared that they didn’t want to purchase back-to-school supplies, suggesting that the teachers should go buy them themselves or go to donation drives and do the legwork themselves. Others shared stories of classrooms that weren’t ‘cute enough’ or didn’t have rugs, implying that the lack of decoration somehow reflected poorly on the teacher – “how dare they not make the room perfect for my child.”
And then there are the posts about rules and policies – things like cell phone bans in classrooms that teachers have no control over. In some cases, parents have gone as far as encouraging their children to disobey those rules, placing teachers in an impossible position.
Viral posts don’t tell the whole story of public education: our communities do.
I’ll be honest, when these posts go viral, it can feel disheartening. But here’s the thing: I don’t believe they reflect the majority of families across the United States. Instead, they seem to be part of a louder narrative that seeks to chip away at public education and those who dedicate their lives to it. And this is a problem.
The truth is, public education is one of the cornerstones of our country. It has always been, and should always be, a place where every child has access to learning, growth, and opportunity. Funding cuts at every level – from Kinder through universities – have made the work harder, but the mission remains the same: serving students and setting them up for future success.
And here’s the good news: in my community, I see something different from what goes viral. I’m sure you do too. I see families who send their students to school with supplies. I see kindness, collaboration, and a shared commitment to doing what’s best for kids.
That’s the story we need to remember and share. Viral posts may grab attention, but they don’t represent the heart of our communities. Let’s not fall prey to negativity; there’s already too much of that. Instead, let’s lift up the good, celebrate the work being done, and continue to build strong schools for our students. They deserve the best, no matter their zip code.
Because in the end, when we support public education, we’re not just supporting teachers, we’re investing in our children and in the future we all share.
Death by Laminator: A Cautionary Tale
There I was, in the staff lounge, ready to take on a brand-new school year. The 3rd-grade teachers were gathered in a semi-circle, swapping stories and laughing about their summer and getting ready for the new school year. I, meanwhile, was at the laminating machine — fully impressed that we had the good stuff this year. You know… the thick laminating plastic. Premium.
I was happily feeding in Clever Badges for the Kinder and 1st grade teachers, feeling oddly proud of my laminating skills, when suddenly… I felt it.
The pull.
Not an emotional pull. Not the pull of destiny.
A literal pull — from the laminator.
At first, I thought, “That’s weird.” Then I tried to step back and realized… I was stuck. In. The. Laminator.
That’s right. I almost died by laminator.
I squeaked out a panicked little “Ahhh!” and the entire 3rd grade team leapt into action like a squad of heroes in a very low-budget action film. Turns out, my lanyard — with my keys and name badge — had been sucked straight into the machine.
We slammed the stop button.
We breathed a sigh of relief.
And then… wave two of panic hit me.
My keys were lodged between the rollers. If you know anything about laminators (and honestly, who does until disaster strikes?), you know that messing with the rollers is basically laminator homicide. I did not want that on my record.
This is when I remembered the genius of my breakaway lanyard. I unclicked it, freed myself from the beast, and began the slow, shame-filled walk to the office. Head hung low.
Now, it’s the beginning of the school year, which means the secretary is juggling about 47 fires at once. I very gently asked for her help. She looked at me and said, “You didn’t break it, did you?”
Inside, I was thinking, Goodness, I hope not… because I like having friends here. I also like the secretary.
Could I have tried to fish out the keys myself? Sure. But that would have almost guaranteed turning a mildly embarrassing story into a full-on “Lisa killed the laminator” legend. And listen — school secretaries are magical. They can fix nearly anything. Copier jam? Fixed. Wi-Fi down? Fixed. Laminator holding your keys hostage? Also fixed.
She followed me in, took one look at the situation, then at me, and asked, “What in the world did you do?” Then she freed my keys — which, fun fact, were now scorching hot.
Lessons learned:
- Always watch your lanyard.
- Know when to call for backup.
- If we get a safety video on “proper laminator use” next year, my bad.
Oh — and when I didn’t return to my room (which I share with two other coaches), one of them came looking for me. She found out what happened and laughed so hard she was crying, and I’m pretty sure she needed a minute to breathe.
And that’s how I started my school year: by nearly becoming a cautionary tale in the staff handbook. Hopefully, yours was or will be better than mine.
Navigating Adult Cliques: Cultivating Kindness in Schools
The idea that cliques exist as an adult is weird. Don’t get me wrong, I get that there are people I would rather hang out with, but being cliquish about it is a whole other thing.
This is one of the many thoughts I have as I prepare to return to school. As educators, we strive to instill kindness in our students. We teach them that while they may not get along with everyone, it is important to be kind; inviting peers to play at recess, greeting one another, and engaging with those who are alone are essential actions. However, when we step into the teachers’ lounge, the reality often reflects a different story. Sadly, many can relate to this experience.
As an adult, I have observed cliques, exclusion, and unkind behaviors, which is perplexing. We should strive to be kind to everyone. If we advocate for inclusion, we must also practice it. If we promote equality, we should embody it. When we discuss kindness and compassion, it is essential to implement these values in our daily lives.
As we approach the new school year, it’s important to reflect on our community. This transition brings new teachers, some of whom may be unfamiliar with their surroundings or have just moved to the area for their new positions. In this spirit, let us practice kindness and inclusivity by inviting everyone to join us at our tables. A simple smile or a friendly greeting in passing can truly brighten someone’s day.
One final thought. Many years ago, Ed Campos talked about ways to include others and bring them into our circles. He focused on doing this at conferences. He shared his idea when standing around and talking to others: leave a space open for others to join. Having a closed circle is uninviting, but by leaving a space, that circle is open and inviting. So, I guess I’m drawing inspiration from Ed; leave a space for others to join, you never know what greatness is out there.
New MathReps Available in Snorkl Library
It’s been a crazy summer. In the last post, I talked about MathReps living in the Snorkl App – a sampling of MathReps, not the full collection. Well, I’m proud to say that they ARE indeed up and ready for you to use. Currently, K-2 is live with others being added regularly. The plan is to have a sampling from K through high school available.
So, where might you find them on the website? I’m so glad you asked. Log in to Snorkl App. Once logged in, navigate to the ‘Library’ tab. Click on the down arrow and select ‘Snorkl Library’.

Once in the Snorkl Library, navigate to the ‘General’ section. That’s where you’ll find MathReps.

That’s right, you’ll see 37 ready-to-use MathReps! Snorkl will continue to add to them as they are ready. 3rd-grade is in the works as I write this. If you have any questions or requests, please feel free to reach out, and I’m happy to help.

MathReps & Snorkl
Oofta, it’s been a hot minute. I’d like to blame end-of-the-year craziness on my lack of posting, but that’s not the whole story. The other part is that I just haven’t been motivated. Welp, I’m back!
Today, I’d like to briefly touch on a new(ish) app – Snorkl. This tool utilized AI in the best way. Students record their work via screen recording, voice and screen recording, only audio, or written. I have been focusing on the voice and screen recordings. This quick video shows how I built out a 1st-grade MathRep and how students can show their work. I know, you’re thinking, “So where is the AI?” So glad you had that thought; it comes in the form of immediate feedback in this case. It’s so much easier if I show you:
So what are your thoughts? How can you see utilizing Snorkl in your classroom?
Let’s Talk Math
My current position, Tech TOSA/Instructional Coach, affords me the opportunity to go into teachers’ classrooms and share the amazing things that are happening. So here I am sharing what this talented first-grade teacher in my district is doing.

Earlier in the week, I was in my Tech TOSA role. I went into this first-grade classroom to teach a lesson on coding using Beebots. I’m sure you’ve figured out this is not what I’m here to discuss. When I walked in, I noticed this chart on her board. What struck me about it was its simplicity. As you can see, it has some basic concepts and images to accompany it. What also drew my attention was the title: Let’s Talk Math. This implies that Math is something that should be discussed. It’s not something we do in isolation or keep to ourselves. While I did not have time to discuss with the teacher what she does with this chart, I know her well enough to say that she references it consistently.
I think it’s worth noticing that this is not flashy, cutesy, or Pinteresty in any way. Too often, we teachers ‘do too much,’ as the kids would say. That isn’t to say that those who make their room match or aesthetically pleasing “do too much.” It’s just to say that if you’re not that kind of teacher—like me—that’s okay. Having something as simple as a chart on your whiteboard works just as well. The important thing here is accessibilty – both in terms of understanding and placement – is most important. If it’s in a place where students can’t see it, like being too high up, or teachers don’t reference it, it’s no good to anyone.
What is my point in all of this? I wanted to celebrate the awesomeness of what this teacher is doing and highlight its simplicity. What are some simple ways you keep your students engaged while encouraging discussions?
NOTE: You may have noticed that I use hyphens in my writing. This has been a thing for me for many years: you can find them in previous posts dating back to pre-AI. I also know that AI uses them often, and it is one of the tell-tale signs that something has been written with AI. I felt the need to point out that while I use them, they are not a result of AI, just of my own knowledge of how to use them.
Effective Place Value Techniques for Teaching Addition
Are you looking for a way to help students truly see what’s happening when they add multi-digit numbers? One powerful approach uses place value-based strategies that build from representational thinking toward more efficient, abstract methods.
Start with Expanded Form
In the first part of the video, I model a place value strategy using expanded form. Students break apart each number into hundreds, tens, and ones, add those values separately, and then combine their sums.
This representational method supports flexible thinking and strengthens their understanding of how numbers work. It also lays a strong foundation for future strategies that depend on place value fluency.
Scaffold Toward the Algorithm
Next, I introduce a slightly more advanced approach that continues to use the Hundreds Chart as a scaffold. This visual support helps students begin to internalize regrouping and transitions them toward the traditional addition algorithm, a 4th-grade standard.
This shift is intentional. By gradually moving from expanded form to a structure that supports the algorithm, students develop a deeper understanding of why the algorithm works—not just how to use it.
Support with Consistent Structure
The real power of MathReps lies in their consistency. Each template reinforces key math skills in a familiar format, allowing students to focus on developing strategies and precision rather than navigating new instructions each time.
Whether students are practicing during warm-ups, small groups, or independent work, MathReps create a rhythm of reflection and growth with immediate feedback.
Grab the Free Templates
The MathReps template shown in the video is available for free at MathReps.com. And if you’re looking for a reusable option, check out the dry-erase Wipebook versions—perfect for centers, partner work, or teacher modeling.
One Rep at a Time
With MathReps, you’re not just assigning practice—you’re building confidence, one rep at a time.
Why Manipulatives Matter Beyond Early Grades
In the early grades, it’s not uncommon to see math manipulatives used daily in the classroom. Teachers pull out connecting cubes, counters, base ten blocks, and more—tools that help students build a concrete understanding of math concepts. Whether they’re exploring different ways to make 10 or practicing addition, these hands-on tools support their thinking in meaningful ways.

This follows the CRA model—Concrete, Representational, Abstract. We start with the concrete, like manipulatives. Once students have a solid grasp of the concept, we move into the representational, such as drawings or visual models. Finally, we introduce the abstract, using numbers and symbols alone. For example:
- Concrete: Use connecting cubes to model 5 + 3
- Representational: Draw 5 circles and 3 more
- Abstract: Solve 5 + 3 = 8
But here’s what I’ve been thinking about lately: why do we often abandon manipulatives once students move into the upper grades?
Sure, by fourth or fifth grade, many students no longer need cubes for basic addition and subtraction. At that point, they’ve likely mastered those foundational skills and can work abstractly. But what about when we introduce new, more complex concepts—like volume in upper elementary or integers in middle school?
Volume is a great example. It’s a tough concept to grasp without something physical to hold or build. Yet so often, we hand students a formula and expect them to just “get it.” What if we instead gave them time to build with cubes, experiment, and see what volume means before jumping into the numbers?
The same goes for concepts like negative numbers. A number line or clothesline math activity can help students visualize and understand the relationships between positive and negative values. Why skip that step?
All this has me wondering: Is it a time issue? A training issue? Have we simply forgotten how powerful manipulatives can be for older students, too?
I’d love to hear your thoughts.
Do you use manipulatives in your classroom? What grade do you teach? What concepts do you use them for?
Let’s keep the conversation going—and keep math meaningful at every grade level.
