Why Manipulatives Matter Beyond Early Grades

In the early grades, it’s not uncommon to see math manipulatives used daily in the classroom. Teachers pull out connecting cubes, counters, base ten blocks, and more—tools that help students build a concrete understanding of math concepts. Whether they’re exploring different ways to make 10 or practicing addition, these hands-on tools support their thinking in meaningful ways.

This follows the CRA model—Concrete, Representational, Abstract. We start with the concrete, like manipulatives. Once students have a solid grasp of the concept, we move into the representational, such as drawings or visual models. Finally, we introduce the abstract, using numbers and symbols alone. For example:

  • Concrete: Use connecting cubes to model 5 + 3
  • Representational: Draw 5 circles and 3 more
  • Abstract: Solve 5 + 3 = 8

But here’s what I’ve been thinking about lately: why do we often abandon manipulatives once students move into the upper grades?

Sure, by fourth or fifth grade, many students no longer need cubes for basic addition and subtraction. At that point, they’ve likely mastered those foundational skills and can work abstractly. But what about when we introduce new, more complex concepts—like volume in upper elementary or integers in middle school?

Volume is a great example. It’s a tough concept to grasp without something physical to hold or build. Yet so often, we hand students a formula and expect them to just “get it.” What if we instead gave them time to build with cubes, experiment, and see what volume means before jumping into the numbers?

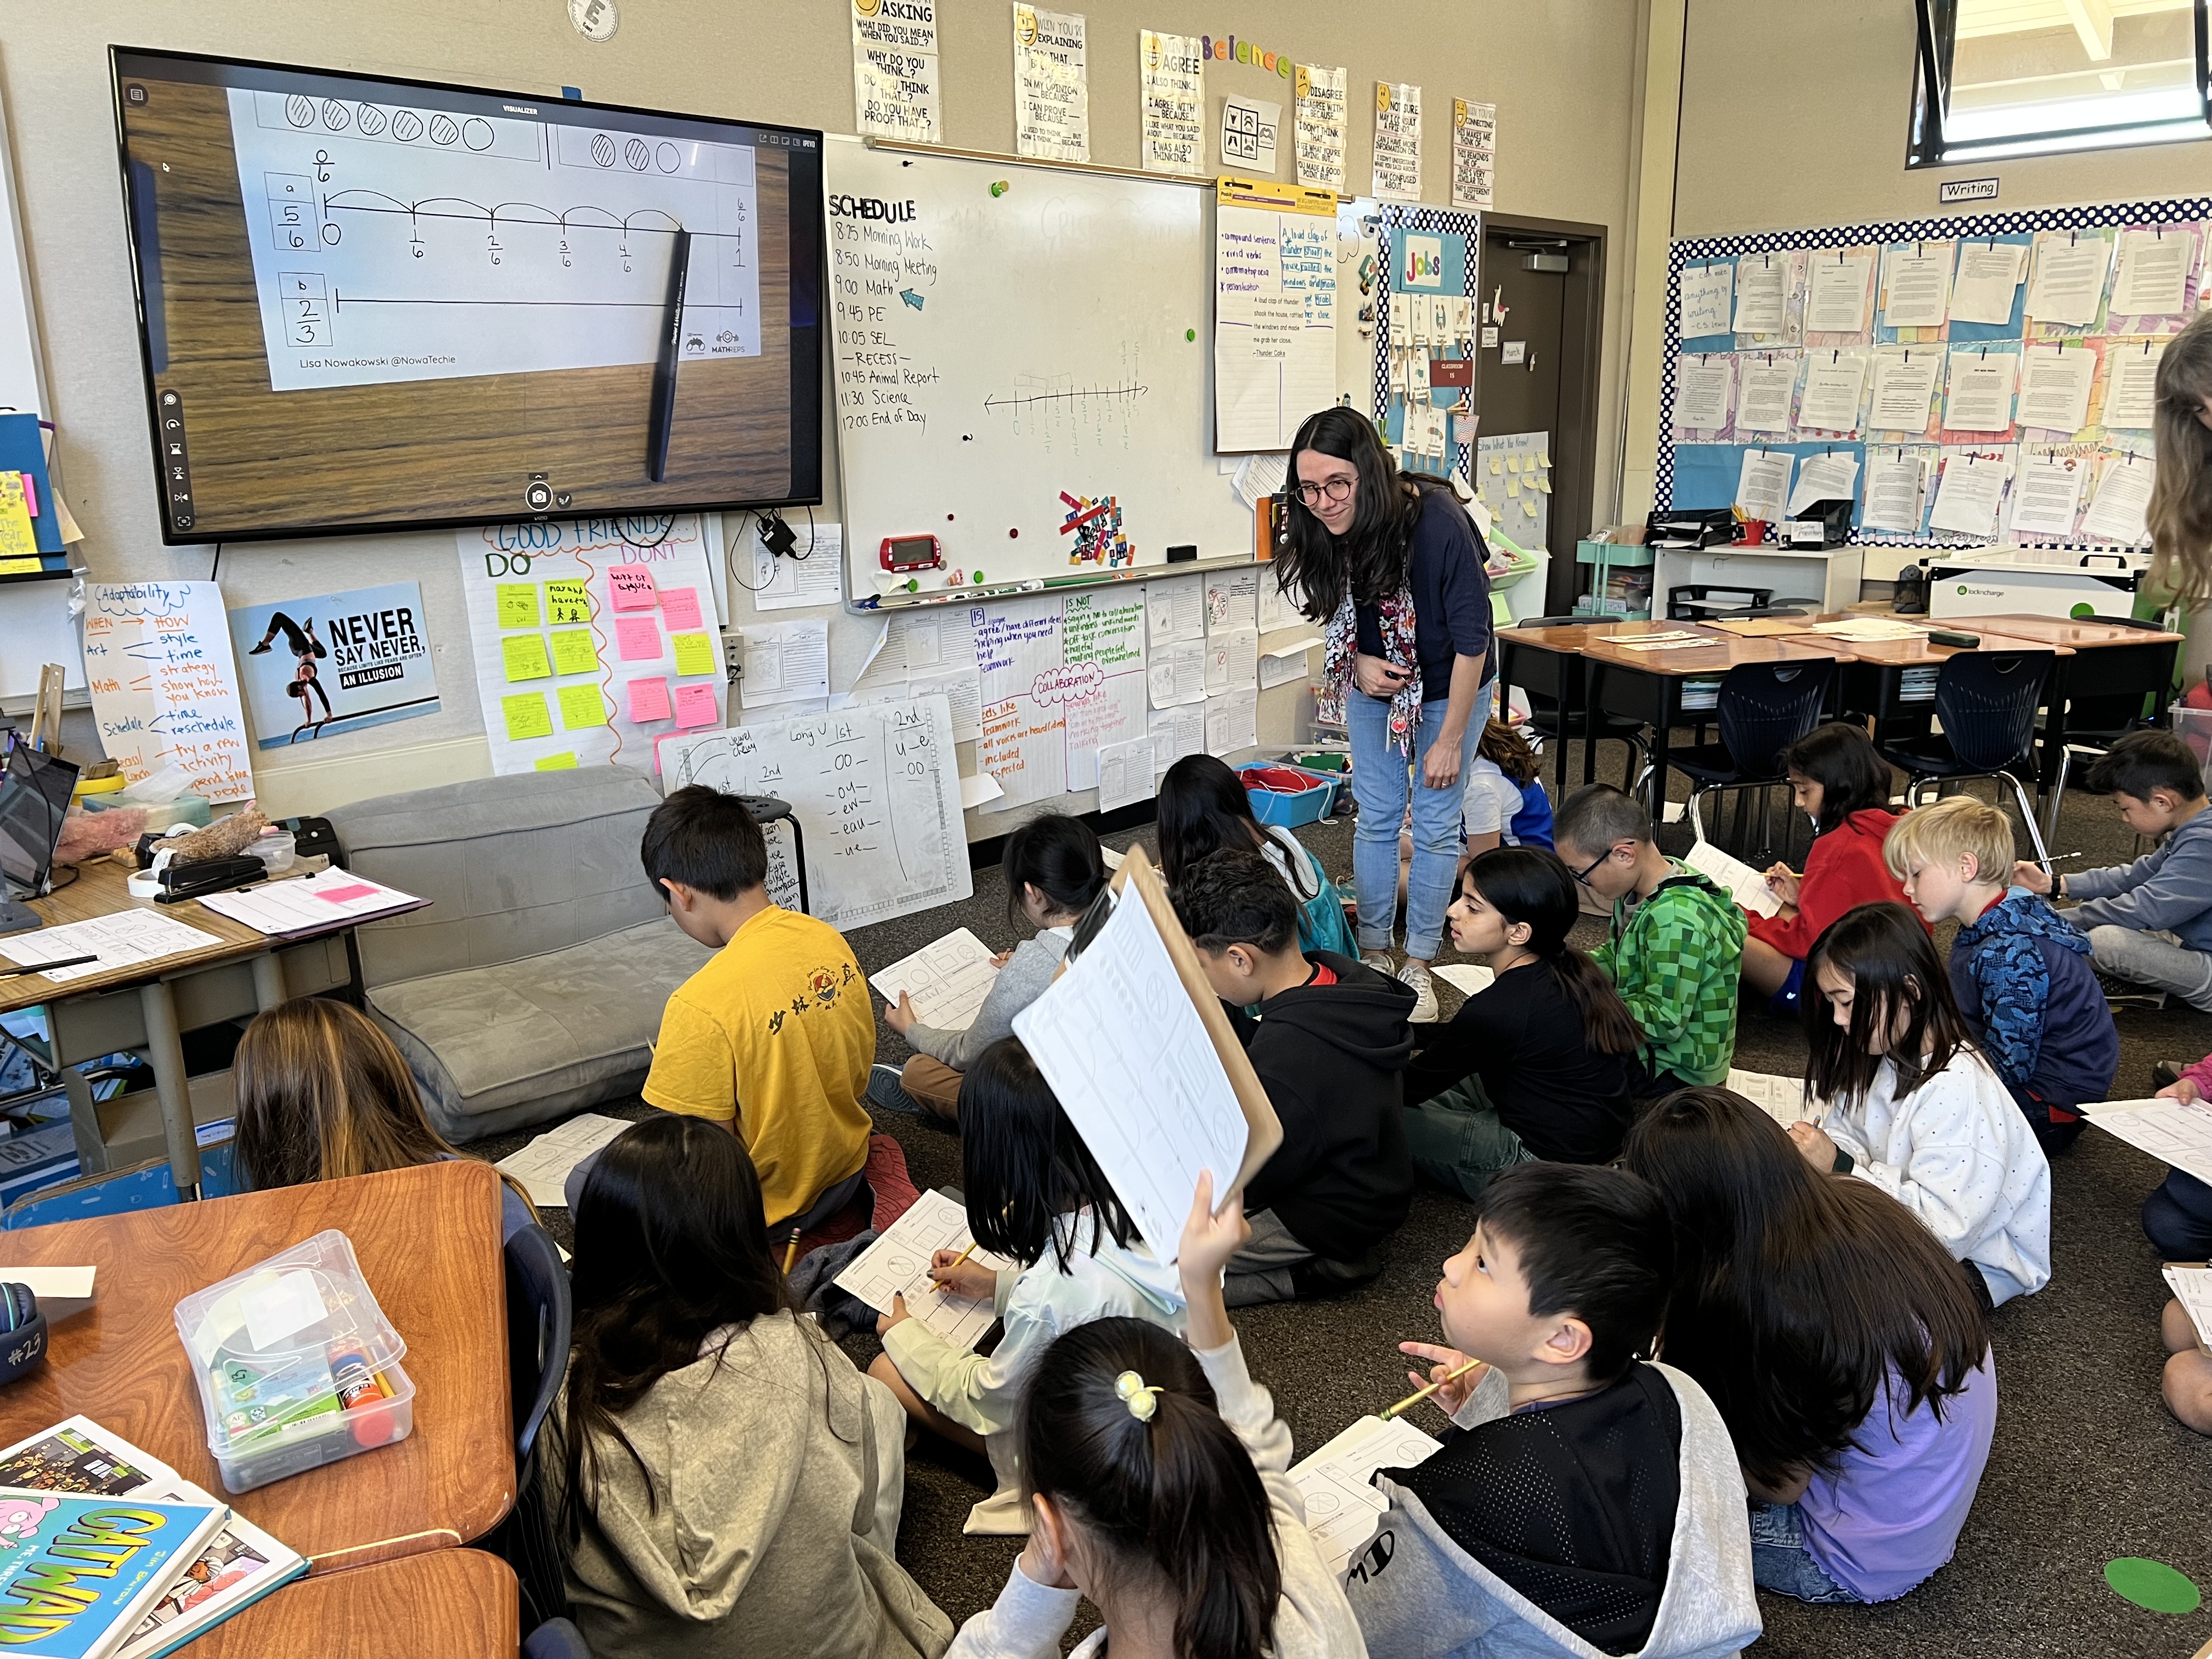
The same goes for concepts like negative numbers. A number line or clothesline math activity can help students visualize and understand the relationships between positive and negative values. Why skip that step?

All this has me wondering: Is it a time issue? A training issue? Have we simply forgotten how powerful manipulatives can be for older students, too?

I’d love to hear your thoughts.
Do you use manipulatives in your classroom? What grade do you teach? What concepts do you use them for?

Let’s keep the conversation going—and keep math meaningful at every grade level.

Experiencing MathReps Success at Cipriani Elementary


A few weeks ago, I had the absolute pleasure of visiting Cipriani Elementary School in Belmont, California, and let me tell you—it was a fantastic day that filled my heart.

Throughout the day, I was met with warm smiles, welcoming teachers, and the most amazing group of students. I had the opportunity to visit several classrooms ranging from TK through fifth grade, and in each room, I was able to demonstrate MathReps and watch in amazement as students flourished in their math knowledge.

What stood out most to me during these classroom visits was the level of engagement and understanding the students displayed. They were respectful, kind, curious, and so eager to learn. It’s one thing to talk about the power of MathReps—but it’s another thing entirely to see it in action in so many classes.

The Cipriani staff was incredible. Not only were they open and receptive, but they also shared their own tips and tricks for how they modify and adapt MathReps to meet the needs of their students. I was genuinely inspired by the way they’ve made the framework their own. I came to share—but I left having learned so much from them too. That kind of collaborative energy is what makes this work so meaningful.

One of my favorite moments from the day happened in a third-grade classroom. As I was working with the students, one of them looked up at me, wheels turning in their head, and said, “Wait… your name is on the bottom of our MathReps!” The class instantly lit up with excitement. Then they asked, “Did you also make Math Dash Chats?” When I said yes, the energy doubled. That little moment of connection—of realizing that the person who created something they use every day was standing right there with them—was truly special. It reminded me that kids are paying attention, even when we don’t think they are.

Later that afternoon, I led a Math 360 professional development session with the entire staff. Thanks to our friends at Wipebook, we had large Wipebook flip charts to work with, and it made the experience even more interactive and fun. The discussions were rich and reflective, and once again, the Cipriani teachers brought their full selves to the table—asking great questions, sharing insights, and showing a genuine passion for improving math instruction.

Overall, it was such a rewarding, joy-filled day. I left Cipriani Elementary feeling deeply grateful—and even more motivated to continue visiting classrooms across the country to share the love, importance, and power of MathReps.

I am thankful to everyone at Cipriani Elementary for making me feel so welcome.

How to Add Watermarks in Google Docs Easily

Watermarks Google Docs can be useful, whether you’re branding them or marking them as drafts. Adding a watermark is super simple. Here’s how:

Step 1: Open Your Google Doc

Start by opening the document where you want to add a watermark.

Step 2: Access the Watermark Tool

  • Click on Insert in the menu bar.
  • Scroll down and select Watermark.

Step 3: Choose an Image or Text

  • Image Watermark: Upload an image from your computer, Google Drive, or the web. Adjust its transparency and size as needed.
  • Text Watermark: Type your desired text (e.g., “Brand” or “Draft”), then customize the font, size, and transparency.

Step 4: Apply & Save

Once your watermark looks good, click Done, and it will be applied to every page in your document.

Why Use Watermarks?

✔ Protects your work
✔ “Draft” signifies that it’s a work in progress and not final

Check out this video on how to add a watermark in Google Docs with just a few clicks!

Spice Up Your Math Lessons with the Nacho Problem EduProtocol!

Allow me to introduce you to an engaging and effective way to get your students thinking critically about math: Nacho Problem! If you’re looking for a structured-yet-flexible approach to problem-solving that promotes discussion, reasoning, and collaboration, then this EduProtocol is exactly what you need.

What is Nacho Problem?

Nacho Problem is a structured math discussion protocol that helps students develop their problem-solving and reasoning skills in a low-floor, high-ceiling way. Instead of just solving problems in isolation, students work through an incorrectly solved problem that leads to, explaining their thinking, and building deeper conceptual understanding.

It’s not just any problem—it’s “Nacho” Problem because it encourages students to engage with math differently!

How It Works

Nacho Problem follows a consistent routine that makes math discussions more meaningful and accessible for all learners. Here’s a breakdown of the process:

Launch the Problem:

  • Choose a problem that has been solved incorrectly. It can be a common misconception or a key concept.
  • Present the problem to the class and encourage students to think critically.

Think & Solve:

  • Students work independently or in pairs to solve the problem using their own methods.
  • They show their thinking through models, equations, or number lines.

Share & Compare:

  • Students explain how they solved it and compare their work with others.
  • Emphasize multiple strategies—there’s more than one way to solve a problem!

Debrief & Reflect:

  • Discuss which strategies were efficient, clear, or creative.
  • Make connections between representations and reinforce math vocabulary.

Why Use Nacho Problem?

🔹 Builds Math Confidence – Encourages all students to participate in math discussions.
🔹 Focuses Thinking – Students can critically analyze problems, looking for errors and correcting them.
🔹 Reinforces Multiple Strategies – Helps students see different ways to approach a problem.
🔹 Encourages Math Talk – Improves reasoning, justification, and communication skills.
🔹 Works with Any Grade Level – Can be adapted for K-12 by adjusting the complexity of the problem.

Hear About It In Under 2 Minutes

I recently created a video tutorial to show exactly how Nacho Problem works. Check it out here:

Try It in Your Classroom!

Want to give Nacho Problem a try? Here’s what you can do next:

Choose a problem that fits your students’ current math skills.
Use a template to help students structure their thinking.
Encourage collaboration by having students discuss and compare strategies.

You can find free templates and more math strategies at eduprotocolsplus.com and MathReps.com!

Final Thoughts

Nacho Problem is a fun, engaging, and powerful way to deepen students’ understanding of math. By making math conversations routine and structured, you’ll see more confidence, curiosity, and engagement in your classroom.

Understanding Subtraction with Pictorial and Expanded Models

Why Use Multiple Models?

By using a pictorial model alongside expanded notation, students get a visual and numeric understanding of subtraction. This helps them move beyond memorized procedures to truly grasp why and how regrouping works.

Let’s break it down step by step!

Step 1: Set Up the Problem

We’re working with 736 – 274.

  • 736 is represented using pictorial models in a place value chart:
    • 7 hundreds
    • 3 tens
    • 6 ones
  • Below, we note in the corner of each place value column what we’re subtracting: 200 + 70 + 4 = 274

Step 2: Subtract Using the Pictorial Model

Subtract the Ones (6 – 4):

  • Cross off 4 ones (I like to use x to represent 1s).
  • That leaves 2 ones.

Regroup the Tens (30 – 70):

  • Uh-oh! We don’t have enough tens to subtract 70.
  • So, we regroup 100 into 10 tens (since 100 = 10 tens).
  • Now, we have 13 tens total (13 tens = 130)
  • We subtract 70 (or 7 tens) from 13 tens, leaving 6 tens (or 60).

Subtract the Hundreds (700 – 200):

  • After regrouping, we have 600 left in the hundreds place.
  • Subtracting 200 leaves us with 400.

Final Answer: 462

Step 3: Solve Using Base 10 Expanded Notation

Now, let’s represent the numbers in expanded form:

  • 736700 + 30 + 6
  • 274200 + 70 + 4

Subtracting step-by-step:

  • 6 – 4 = 2
  • 30 – 70 (not possible, so we regroup from the hundreds)
    • Moving 100 over to the 10s place, making it 130 – 70 = 60
  • 600 – 200 = 400

Final Answer: 462

The Power of Dual Modeling

Using both pictorial and expanded form models side by side helps students see:
✏️ Why we “regroup” in subtraction
✏️ How place value plays a role in regrouping
✏️ That both methods lead to the same solution, reinforcing accuracy

When students see and practice both models together, they build deeper number sense and mathematical confidence!

Try This in Your Classroom!

You can grab a free MathReps template at MathReps.com and start using this strategy with your students today!

💡 Bonus Resource: Wipebook offers workbooks with four MathReps for second grade, providing structured practice all year long. Check them out!

Watch the Full Tutorial Video

Effortless Speaker Notes: Voice Typing in Google Slides

I’m here to share another quick and easy Google Slides tip with you. Have you ever found yourself struggling to keep up with typing your speaker notes? Or maybe your thoughts come faster than your fingers can type? Well, Google Slides has a built-in voice typing feature that makes adding speaker notes effortless. No copying, no pasting—just speaking!

Let’s dive in and explore how to dictate your speaker notes in Google Slides.

Step 1: Expanding Your Speaker Notes Section

When you’re working in Google Slides, you’ll find a section at the bottom labeled Speaker Notes. This is where you can jot down key points, reminders, or even your full script for a presentation. If you need more space:

  • Click and hold the small bar above the Speaker Notes section
  • Drag it upward to increase the size

Now you have a larger, more comfortable space to work with!

Step 2: Activating Voice Typing

Instead of typing manually, you can dictate your notes using your voice. Here’s how:

  1. Click on the Tools menu at the top of Google Slides.
  2. Select Dictate Speaker Notes.
  3. A microphone icon will appear and turn red, indicating it’s recording your voice.
  4. Start speaking, and Google Slides will transcribe your words in real time!

That’s it—your notes are being typed automatically as you talk!

Real-World Use Cases

Voice typing isn’t just convenient—it can be a game-changer for students and educators.

I once had a student who used this feature while I was giving directions. This allowed her to capture everything I said, and she could go back and review it later. It’s a fantastic tool for students who need to reference instructions, as well as for teachers who want to create clear, accessible notes for their presentations.

Final Thoughts

Voice typing in Google Slides is quick, simple, and super efficient. Whether you’re preparing for a presentation, creating lesson plans, or helping students stay organized, this feature saves time and enhances accessibility.

Try it out and see how it improves your workflow!

Effective MathReps for Addition with Regrouping

Today, we’re diving into second-grade math with a MathRep that focuses on addition with regrouping.

In our previous posts, we explored using MathReps for addition and subtraction without regrouping. Now, we’re taking it a step further and tackling regrouping, helping students make the jump from pictorial models to expanded notation and the base 10 system.

So, buckle in—let’s get started!

Step-by-Step Guide: Regrouping with MathReps

Set Up the Numbers

For this example, we’re adding 682 + 234, and we’ll use a pictorial model to visually represent the numbers before transitioning into the expanded form.

Solve Using a Pictorial Model

1️⃣ Start with the Ones Place:

  • 2 + 4 = 6
  • No regrouping needed here, so we write 6 in the ones place.

2️⃣ Move to the Tens Place:

  • We add 8 tens + 3 tens = 11 tens, which equals 110.
  • Since 10 tens = 100, we regroup by circling ten tens and moving them into the hundreds place.
  • This leaves 1 ten (10) in the tens place.

3️⃣ Move to the Hundreds Place:

  • We now have 6 hundreds + 2 hundreds + 1 regrouped hundred = 9 hundreds.

Bringing it all together:
916

Transition to the Base 10 Model (Expanded Notation)

Now, let’s break it down using expanded form:

  • 682 → 600 + 80 + 2
  • 234 → 200 + 30 + 4

Adding the place values:

  • Ones: 2 + 4 = 6
  • Tens: 80 + 30 = 110 → Regroup into 100 + 10
  • Hundreds: 600 + 200 + 100 = 900

Total: 916

Alternative Thinking: Flexible Number Sense

Instead of regrouping immediately, students can leave the tens as 110 and think of the sum as:

800 + 110 + 6 = 916

This approach challenges students to see numbers flexibly before applying the standard algorithm, deepening their conceptual understanding.

Why This Works

MathReps provide a structured, visual approach that helps students bridge the gap between pictorial models and formal mathematical notation. By working through regrouping in different ways, students develop number flexibility and problem-solving confidence.

Get Your Free MathReps!

Want to try this in your classroom? Download your free MathRep template at MathReps.com and explore even more math resources.

💡 Bonus Resource: Check out Wipebook for workbooks featuring MathReps—each workbook includes four MathReps to last the entire year!

Watch the Tutorial Video

Insert Google Sheets Charts into Slides Effortlessly

Today, we’re diving into a simple but powerful feature in Google Slides—how to insert a chart from Google Sheets into your presentation without copy-pasting.

If you’ve ever needed to share data, track progress, or present reports to colleagues or board members, this tip will save you time and effort. Let’s check it out!

Step 1: Open Your Google Slide Presentation


Start by opening the Google Slides presentation where you want to insert your chart. Navigate to the slide where you need to add the data visualization.

Step 2: Insert a Chart from Google Sheets


Instead of copying and pasting, follow these steps:

  1. Click on Insert in the top menu.
  2. Scroll down to Chart > From Sheets.
  3. A window will pop up showing your available Google Sheets. Select the sheet that contains the chart you need.
  4. Once inside the selected spreadsheet, choose the correct chart by clicking on it (you’ll see a blue border appear).
  5. Click Import, and just like that—bam!—your chart is now in your Google Slide.

No extra formatting, no fuss—just an easy and seamless way to integrate your data.

Step 3: Why Use This Method?


There are several reasons why inserting a chart from Google Sheets into Google Slides is a game-changer:
No manual copy-pasting—saves time and effort.
Live updates—if your data in Google Sheets changes, you can refresh the chart in Slides with a single click.
Consistent formatting—ensures your reports look professional and well-organized.

This feature is especially useful when creating presentations for board meetings, tracking student fluency, or sharing progress reports with colleagues.

I told you it was super easy! Now you can insert charts from Google Sheets into Google Slides like a pro, making your presentations more data-driven and visually appealing.

If you enjoyed this quick Google tip and want to learn more, be sure to like, subscribe, and stay tuned for my next tutorial. Happy presenting, and see you next time!

Subtraction Made Simpler With MathReps

I’m here to show you how MathReps can make subtraction practice easier and more engaging for your students. In our last post, we explored how to use a MathRep for addition, and today, we’ll focus on subtraction.

This step-by-step guide will show you how to use the MathRep template in your classroom, helping students bridge the gap between visual models and abstract concepts.

See this MathRep in action!

Set Up the Numbers

For this example, we’ll work with 658 and 234. The subtraction problem is set up in a pictorial model, where the number 658 is represented visually, and 234 is broken down into ones, tens, and hundreds to subtract from each place value.

Use a Pictorial Model to Subtract

In the pictorial model, each section represents a place value: ones, tens, and hundreds.

  • Subtract the ones:
    • Start with 8 ones and subtract 4.
    • Cross out or erase 4 ones, leaving 4 ones.
  • Subtract the tens:
    • Start with 50 tens and subtract 30 (3 groups of ten).
    • Cross out 3 groups, leaving 20 tens.
  • Subtract the hundreds:
    • Start with 600 hundreds and subtract 200 (2 groups of 100).
    • Cross out 2 groups, leaving 400 hundreds.

Combine the remaining values:
400 + 20 + 4 = 424

Transition to the Base 10 Model

Now, transfer the pictorial model into a base 10 model by writing the numbers in expanded form:

  • 658 → 600 + 50 + 8
  • 234 → 200 + 30 + 4

Follow the same subtraction process:

  • Subtract the ones: 8 – 4 = 4
  • Subtract the tens: 50 – 30 = 20
  • Subtract the hundreds: 600 – 200 = 400

Bring it all together:
400 + 20 + 4 = 424

Why This Works

This activity helps students make meaningful connections between the pictorial model and the base 10 system, reinforcing their understanding of subtraction and place value. By bridging these two models, students gain confidence in solving subtraction problems and build a deeper understanding of the math concepts.

Get Started Today!

Ready to bring this subtraction strategy to your classroom? Head over to MathReps.com to download your free MathReps template and explore more resources for effective math practice.

With MathReps, subtraction doesn’t have to be overwhelming. By providing students with a structured and visual approach, you’re setting them up for success in their math journey. Let us know how it works for your students!

Engage Students with 2nd Grade MathReps Activities

I’m excited to share how MathReps can transform daily math practice into a fun and engaging activity for your students. Whether you’re a seasoned teacher or just starting your journey, MathReps are a fantastic tool to build fluency and confidence in math concepts.

For today’s demonstration, let’s dive into a 2nd-grade MathRep and explore how you can use it in your classroom. This template can also be found on Wipebook Workbooks and Kami!

Blank 2nd grade MathRep for addition or subtraction
Filled in example of the 2nd Grade MathReps template using addition.

Step-by-Step Guide: Using MathReps in Your Classroom

1. Set Up the Numbers

For this example, we’re working with 237 and 422. Begin by deciding whether your students will add or subtract these numbers. For this demonstration, we’ll focus on addition.

2. Use a Pictorial Model

Start by setting up the numbers in a pictorial model.

  • Creating a 100’s chart will help students represent each digit in the numbers.
    • Each x will represent the ones (I prefer x’s over dots as it can become hard to distinguish individual dots)
    • Each l will represent the tens
    • Each square will represent the hundreds
  • Count the ones, tens, and hundreds in each number:
    • Ones: 7 ones + 2 ones = 9 ones
    • Tens: 30 tens + 20 tens = 50 tens
    • Hundreds: 200 hundreds + 400 hundreds = 600 hundreds

Add these values together:
659

3. Transition to the Base 10 Model

Once students understand the pictorial model, encourage them to transfer the information to a base 10 model by breaking down the numbers into expanded form:

  • 237 → 200 + 30 + 7
  • 422 → 400 + 20 + 2

Have the students add the expanded forms:

  • Add the ones: 7 + 2 = 9
  • Add the tens: 30 + 20 = 50
  • Add the hundreds: 200 + 400 = 600

Bring it all together:
600 + 50 + 9 = 659

Why It Works

This activity bridges the gap between pictorial models and abstract math concepts. Students not only practice addition but also develop a deeper understanding of place value and number decomposition.

Get Started Today!

Ready to try this out in your classroom? Visit MathReps.com to download your free MathReps template and discover more resources for math practice.

By using MathReps, you’re helping students build foundational skills in a way that’s both structured and engaging. Give it a try, and let us know how it works for your students!

Check It Out In Action!