Let’s (Line) Plot Something

If you are a 3rd-grade teacher looking to engage students with the concept of line plots, you are not alone. The task of transferring data onto a number line may seem straightforward to adults, but for young learners, it can be quite challenging. The 3.MD.B.4 standard, a supporting cluster in the Common Core Standards, plays a substantial role in reinforcing the understanding of fractions and measurement. This means that as students delve into the world of line plots, they are simultaneously immersing themselves in the intricate connections between fractions on number lines, and measurement. It’s a perfect illustration of how math is both messy and beautiful, all intertwined in a way that connects to the real world.

Putting It All Together
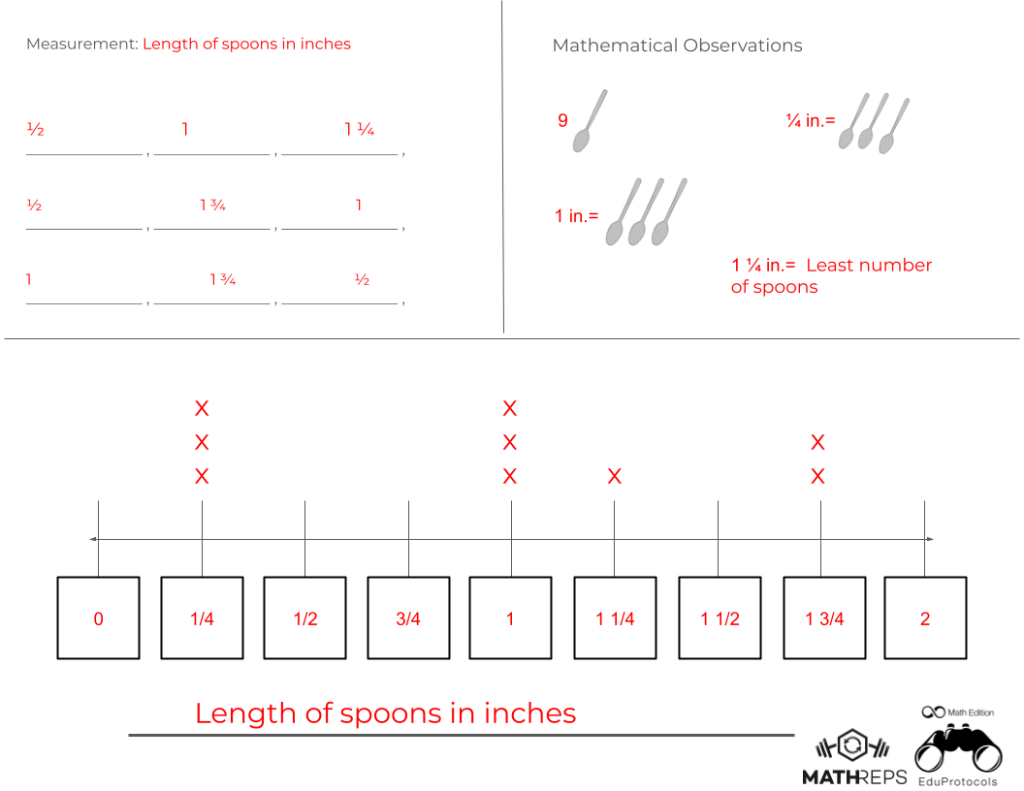
Here is an example of what this integration could look like. This MathRep integrates the fractions on a number line and measurement. The information is collected in the upper left quadrant. Students then fill in the information on the line plot. In the upper right quadrant, they can record their mathematical observations. Much like in the previous blog post, the observations serve as a low-floor, high-ceiling activity—one that all students can access and be successful in.

Teacher Set Up

The MathRep method grants teachers flexibility. Its primary aim is to offer consistent learning experiences for students while minimizing the teacher's preparation workload. When implementing this approach, teachers can start by providing all the necessary data in the upper left quadrant and should ensure variation in the data to allow the line plot to start at different points. For example, if a line plot ranges from 0 to 2, it's beneficial to vary it so that it may start at 5 on one occasion and 9 on another. In 3rd grade, students typically work with whole numbers, halves, and fourths. However, the provided data may not always include fourths, so students should adjust the intervals accordingly. As students become proficient in recording data on a line plot, they can then be tasked with measuring objects, recording the data, and accurately placing it on the line plot. No matter where in the process you find yourself, be sure to encourage students to record all mathematical observations in the upper right quadrant. 

Outcomes

The outcomes of this MathRep further build students’ number sense, understanding of fractions, measurement, and data interpretation. It also illustrates how math concepts are interconnected and can be taught together instead of isolated. Another simple yet powerful activity. Have you tried it yet? What are your thoughts?

Measurement & Data Excite Me!

When you think about data, the first thoughts that come to mind might be how dull or uninspiring it can be. But what if there was a way to turn that perception around and make learning about data an exciting journey for elementary school students?

Enter the newest MathRep. This template is designed to engage students while teaching bar graphs and picture graphs to young learners.

In this blog, we will delve into how this new MathReps template is exciting elementary math students. It offers educators a fresh and dynamic method to ignite enthusiasm for data interpretation among their students. Get ready to explore the possibilities and discover how this MathRep can make a real difference in the classroom!

Picture This

This is an example that aligns to 3rd-grade standards: 3.MD.B.3 Draw a scaled picture graph and a scaled bar graph to represent a data set with several categories. Solve one- and two-step “how many more” and “how many less” problems using information presented in scaled bar graphs.

You’ll notice that the same information is used to complete each of the graphs. This leaves quadrant 4. It can have questions about how many more and how many less, but why not allow students to observe the data and make their own observations. Leaving it open-ended like this allows all students to be successful. In addition, you will have students making observations that go beyond how many more/less.

The Setup

When first introducing this MathRep activity, it is recommended to provide students with the information located in the center of the paper. Subsequently, they can proceed to create the graphs themselves. Once they have gained proficiency in graph creation, the teacher can fill in the graph and task the students with completing the remaining sections, including the center. For a more advanced approach, the teacher can fill in the ‘Mathematical Observations’ square (quadrant 4), leaving the rest to the students. This adaptable strategy can effectively challenge students at various proficiency levels, guiding them toward a deeper comprehension of the material.

What Will You Do?

The power of this MathRep lies in its ability to enable students to interact with data in multiple ways simultaneously. This allows students the opportunity to make connections between different representations of information, leading to a deeper understanding. Teaching skills in isolation should and has been discontinued according to the Common Core Math Clusters, as math is intertwined with all aspects of learning. This MathRep illustrates these connections, preparing students for future success.